Koch curve
Draw a Koch curve. See details: Koch curve

You are encouraged to solve this task according to the task description, using any language you may know.
Action!
Action! language does not support recursion. Therefore an iterative approach with a stack has been proposed.
<lang Action!>INCLUDE "H6:REALMATH.ACT"
DEFINE MAXSIZE="20"
INT ARRAY SinTab=[
 0 4 9 13 18 22 27 31 36 40 44 49 53 58 62 66 71 75 79 83
 88 92 96 100 104 108 112 116 120 124 128 132 136 139 143
 147 150 154 158 161 165 168 171 175 178 181 184 187 190
 193 196 199 202 204 207 210 212 215 217 219 222 224 226
 228 230 232 234 236 237 239 241 242 243 245 246 247 248
 249 250 251 252 253 254 254 255 255 255 256 256 256 256]
BYTE ARRAY
depthStack(MAXSIZE),stageStack(MAXSIZE)
BYTE stacksize=[0]
INT FUNC Sin(INT a)
 WHILE a<0 DO a==+360 OD
 WHILE a>360 DO a==-360 OD
 IF a<=90 THEN
   RETURN (SinTab(a))
 ELSEIF a<=180 THEN
   RETURN (SinTab(180-a))
 ELSEIF a<=270 THEN
   RETURN (-SinTab(a-180))
 ELSE
   RETURN (-SinTab(360-a))
 FI
RETURN (0)
INT FUNC Cos(INT a) RETURN (Sin(a-90))
BYTE FUNC IsEmpty()
IF stacksize=0 THEN RETURN (1) FI
RETURN (0)
BYTE FUNC IsFull()
IF stacksize=MAXSIZE THEN RETURN (1) FI
RETURN (0)
PROC Push(BYTE depth,stage)
 IF IsFull() THEN Break() FI
 depthStack(stacksize)=depth
 stageStack(stackSize)=stage
 stacksize==+1
RETURN
PROC Pop(BYTE POINTER depth,stage)
 IF IsEmpty() THEN Break() FI
 stacksize==-1
 depth^=depthStack(stacksize)
 stage^=stageStack(stacksize)
RETURN
PROC DrawKoch(INT x,y REAL POINTER len BYTE depth)
 BYTE stage
 INT angle=[180],c
 REAL rx,ry,r256,tmp1,tmp2
 IntToReal(x,rx)
 IntToReal(y,ry)
 IntToReal(256,r256)

 Push(depth,0)
 WHILE IsEmpty()=0
 DO
   Pop(@depth,@stage)
   IF depth=0 THEN
     Plot(x,y)
     ;x==+Cos(angle)*len/256
     c=Cos(angle)
     IntToRealForNeg(c,tmp1)
     RealDiv(tmp1,r256,tmp2)
     RealMult(tmp2,len,tmp1)
     RealAdd(rx,tmp1,tmp2)
     RealAssign(tmp2,rx)
     x=RealToInt(rx)
     ;y==-Sin(angle)*len/256
     c=Sin(angle)
     IntToRealForNeg(c,tmp1)
     RealDiv(tmp1,r256,tmp2)
     RealMult(tmp2,len,tmp1)
     RealSub(ry,tmp1,tmp2)
     RealAssign(tmp2,ry)
     y=RealToInt(ry)
     DrawTo(x,y)
   ELSE
     IF stage=1 THEN
       angle==-60
     ELSEIF stage=2 THEN
       angle==+120
     ELSEIF stage=3 THEN
       angle==-60
     FI
     IF stage<=3 THEN
       Push(depth,stage+1)
       Push(depth-1,0)
     FI
   FI
 OD
RETURN
PROC Main()
 BYTE CH=$02FC,COLOR1=$02C5,COLOR2=$02C6
 REAL len
 Graphics(8+16)
 Color=1
 COLOR1=$0C
 COLOR2=$02
 ValR("3.7",len)
 DrawKoch(10,140,len,4)
 DO UNTIL CH#$FF OD
 CH=$FF
RETURN</lang>
- Output:
Ada
<lang Ada>with Ada.Command_Line; with Ada.Numerics.Generic_Elementary_Functions; with Ada.Text_IO; with PDF_Out;
procedure Koch_Curve is
  package Real_Math is
    new Ada.Numerics.Generic_Elementary_Functions (PDF_Out.Real);
  use Real_Math, PDF_Out, Ada.Command_Line, Ada.Text_IO;
  subtype Angle_Deg  is Real;
  type    Level_Type is range 0 .. 7;
  Purple : constant Color_Type := (0.7, 0.0, 0.5);
  Length : constant Real       := 400.0;
  Corner : constant Point      := (90.0, 580.0);
  Level     : Level_Type;
  Current   : Point      := (0.0, 0.0);
  Direction : Angle_Deg  := Angle_Deg'(60.0);
  Doc       : PDF_Out_File;
  procedure Koch (Level : Level_Type; Length : Real) is
  begin
     if Level = 0 then
        Current := Current + Length * Point'(Sin (Direction, 360.0),
                                             Cos (Direction, 360.0));
        Doc.Line (Corner + Current);
     else
        Koch (Level - 1, Length / 3.0);  Direction := Direction -  60.0;
        Koch (Level - 1, Length / 3.0);  Direction := Direction + 120.0;
        Koch (Level - 1, Length / 3.0);  Direction := Direction -  60.0;
        Koch (Level - 1, Length / 3.0);
     end if;
  end Koch;
begin
  if Argument_Count /= 1 then
     Put_Line ("koch_curve <level>");
     Put_Line ("  <level>   0 .. 7");
     Put_Line ("open koch.pdf to view ouput");
     return;
  end if;
  Level := Level_Type'Value (Argument (1));
  Doc.Create ("koch.pdf");
  Doc.Page_Setup (A4_Portrait);
  Doc.Margins (Margins_Type'(Left   => Cm_2_5,
                             others => One_cm));
  Doc.Color (Purple);
  Doc.Move (Corner);
  for A in 1 .. 3 loop
     Koch (Level, Length);
     Direction := Direction + 120.0;
  end loop;
  Doc.Finish_Path (Close_Path => True,
                   Rendering  => Fill,
                   Rule       => Even_Odd);
  Doc.Close;
end Koch_Curve;</lang>
BASIC256
<lang BASIC256>global RtoD, DtoR RtoD = 180 / Pi DtoR = Pi / 180
global posX, posY, angulo posX = 170 : posY = 100 : angulo = 0
global ancho, alto ancho = 650 : alto = 650 graphsize ancho, alto
subroutine kochLado(longitud, fondo) if fondo = 0 then dx = cos(angulo*DtoR) * longitud dy = sin(angulo*DtoR) * longitud color rgb(5,100,24) line (posX, posY, posX+dx, posY+dy) posX += dx posY += dy else call kochLado(longitud/3.0, fondo-1) angulo += 60 call kochLado(longitud/3.0, fondo-1) angulo -= 120 call kochLado(longitud/3.0, fondo-1) angulo += 60 call kochLado(longitud/3.0, fondo-1) end if end subroutine
subroutine CopoNieveKoch(longitud, recursionfondo) for i = 1 to 6 call kochLado(longitud,recursionfondo) angulo -= 300 next i end subroutine
for n = 0 To 7 clg fastgraphics text 3,4, "Copo de nieve de Koch" text 4,16, "Iteración número: " & n call CopoNieveKoch(280, n) pause 0.8 refresh next n
imgsave "Koch_curve.jpg", "jpg" end</lang>
Amazing Hopper
Based on C++ code. Execute:
            hopper src/kock_curve.com > kockcurve.svg
       or
            ./src/kock_curve.com > kockcurve.svg
<lang Amazing Hopper>
- !/usr/bin/hopper
- include <hopper.h>
- proto generateKockCurve(_S_,_I_)
- proto kochPoints(_S_,_I_)
- proto kochNext(_P_)
main:
  SQRT3_2 = 0.86602540378444
  _generate Kock Curve (600, 5)
exit(0)
.locals generate Kock Curve (_SIZE_, _ITERATIONS_)
   {"<svg xmlns='http://www.w3.org/2000/svg' width='"}
   {_SIZE_,"' height='",_SIZE_,"'>\n"}
   {"<rect width='100%' height='100%' fill='black'/>\n"}
   {"<path stroke-width='1' stroke='white' fill='none' d='"} print

   points=0, let( points := _koch Points(_SIZE_, _ITERATIONS_) )

   vSize=0,size(points),mov(vSize),rows(vSize,nRows)

   for (i = 1; n= nRows, {i}lethan(n), ++i)
       iif( {i,1} eq?, {"M"} , {"L"}), [i,1]get(points), {","}, [i,2]get(points), {"\n"},print
   next
   {"z'/>\n</svg>\n"}print
back
koch Points(_SIZE_, _ITERATIONS_)
   #hl {
        Length = ((_SIZE_ * SQRT3_2) * 0.95)
        x = (_SIZE_ - Length)/2
        y = ((_SIZE_/2) - (Length * SQRT3_2 / 3))
   }
   points={}
   {x, y},addrow(points)
   {x} PLUS ( {Length}div by(2) ), {y} PLUS ( {Length} mul by ( SQRT3_2)), addrow(points)
   {x} plus ( Length), {y},addrow(points)
   {x, y},addrow(points)
   for ( i = 1, {i} lethan ( _ITERATIONS_), ++i)
       let clear( points := _koch Next(points))
   next
   {points}
back
koch Next(points)
   vSize=0,size(points),mov(vSize)

   rows(vSize,nRows)
output={}
x0 = 0,y0=0, x1=0, y1=0
   for ( i = 1, {i}plus(1) lethan( nRows ), ++i)
      #hl{
          x0 = points[i,1]
          y0 = points[i,2]
          x1 = points[(i + 1),1]
          y1 = points[(i + 1),2]
          dy = y1 - y0
          dx = x1 - x0
       }
       {x0, y0} addrow(output)
       #hl{
          x0 + (dx/3)
          y0 + (dy/3)
       }, addrow(output)
       #hl{
          x0 + (dx/2) - (dy * (SQRT3_2/3))
          y0 + (dy/2) + (dx * (SQRT3_2/3))
       },addrow(output)
       #hl{
          x0 + (2 * (dx/3))
          y0 + (2 * (dy/3))
       },addrow(output)
   next
   #hl{
      x1
      y1
   },addrow(output)
   {output}
back </lang>
AutoHotkey
Requires Gdip Library <lang AutoHotkey>gdip1() KochX := 0, KochY := 0 Koch(0, 0, A_ScreenWidth, A_ScreenHeight, 4, Arr:=[]) xmin := xmax := ymin := ymax := 0 for i, point in Arr { xmin := A_Index = 1 ? point.x : xmin < point.x ? xmin : point.x xmax := point.x > xmax ? point.x : xmax ymin := A_Index = 1 ? point.y : ymin < point.y ? ymin : point.y ymax := point.y > ymax ? point.y : ymax } for i, point in Arr points .= point.x - xmin + KochX "," point.y - ymin + KochY "|" points := Trim(points, "|") Gdip_DrawLines(G, pPen, Points) UpdateLayeredWindow(hwnd1, hdc, 0, 0, Width, Height) return
- ---------------------------------------------------------------
Koch(x1, y1, x2, y2, iter, Arr) { Pi := 3.141592653589793 angle := Pi / 3 ; 60 degrees x3 := (x1*2 + x2) / 3 y3 := (y1*2 + y2) / 3 x4 := (x1 + x2*2) / 3 y4 := (y1 + y2*2) / 3 x5 := x3 + (x4-x3)*Cos(angle) + (y4-y3)*Sin(angle) y5 := y3 - (x4-x3)*Sin(angle) + (y4-y3)*Cos(angle) if (iter > 0) { iter-- koch(x1, y1, x3, y3, iter, Arr) koch(x3, y3, x5, y5, iter, Arr) koch(x5, y5, x4, y4, iter, Arr) koch(x4, y4, x2, y2, iter, Arr) } else { Arr[Arr.count()+1, "x"] := x1, Arr[Arr.count(), "y"] := y1 Arr[Arr.count()+1, "x"] := x3, Arr[Arr.count(), "y"] := y3 Arr[Arr.count()+1, "x"] := x5, Arr[Arr.count(), "y"] := y5 Arr[Arr.count()+1, "x"] := x4, Arr[Arr.count(), "y"] := y4 Arr[Arr.count()+1, "x"] := x2, Arr[Arr.count(), "y"] := y2 } }
- ---------------------------------------------------------------
gdip1(){ global If !pToken := Gdip_Startup() { MsgBox, 48, gdiplus error!, Gdiplus failed to start. Please ensure you have gdiplus on your system ExitApp } OnExit, Exit Width := A_ScreenWidth, Height := A_ScreenHeight Gui, 1: -Caption +E0x80000 +LastFound +OwnDialogs +Owner +AlwaysOnTop Gui, 1: Show, NA hwnd1 := WinExist() hbm := CreateDIBSection(Width, Height) hdc := CreateCompatibleDC() obm := SelectObject(hdc, hbm) G := Gdip_GraphicsFromHDC(hdc) Gdip_SetSmoothingMode(G, 4) pPen := Gdip_CreatePen(0xFFFF0000, 2) }
- ---------------------------------------------------------------
gdip2(){ global Gdip_DeleteBrush(pBrush) Gdip_DeletePen(pPen) SelectObject(hdc, obm) DeleteObject(hbm) DeleteDC(hdc) Gdip_DeleteGraphics(G) }
- ---------------------------------------------------------------
Exit: gdip2() Gdip_Shutdown(pToken) ExitApp Return</lang>
C
Interactive program which takes the width, height (of the Graphics window) and recursion level of the Koch curve as inputs, prints out usage on incorrect invocation. Requires the WinBGIm library. <lang C>
- include<graphics.h>
- include<stdlib.h>
- include<stdio.h>
- include<math.h>
- define pi M_PI
typedef struct{ double x,y; }point;
void kochCurve(point p1,point p2,int times){ point p3,p4,p5; double theta = pi/3;
if(times>0){ p3 = (point){(2*p1.x+p2.x)/3,(2*p1.y+p2.y)/3}; p5 = (point){(2*p2.x+p1.x)/3,(2*p2.y+p1.y)/3};
p4 = (point){p3.x + (p5.x - p3.x)*cos(theta) + (p5.y - p3.y)*sin(theta),p3.y - (p5.x - p3.x)*sin(theta) + (p5.y - p3.y)*cos(theta)};
kochCurve(p1,p3,times-1); kochCurve(p3,p4,times-1); kochCurve(p4,p5,times-1); kochCurve(p5,p2,times-1); }
else{ line(p1.x,p1.y,p2.x,p2.y); } }
int main(int argC, char** argV) { int w,h,r; point p1,p2;
if(argC!=4){ printf("Usage : %s <window width> <window height> <recursion level>",argV[0]); }
else{ w = atoi(argV[1]); h = atoi(argV[2]); r = atoi(argV[3]);
initwindow(w,h,"Koch Curve");
p1 = (point){10,h-10}; p2 = (point){w-10,h-10};
kochCurve(p1,p2,r);
getch();
closegraph(); }
return 0; } </lang>
C++
The output of this program is an SVG file depicting a Koch snowflake. <lang cpp>// See https://en.wikipedia.org/wiki/Koch_snowflake
- include <fstream>
- include <iostream>
- include <vector>
constexpr double sqrt3_2 = 0.86602540378444; // sqrt(3)/2
struct point {
   double x;
   double y;
};
std::vector<point> koch_next(const std::vector<point>& points) {
   size_t size = points.size();
   std::vector<point> output(4*(size - 1) + 1);
   double x0, y0, x1, y1;
   size_t j = 0;
   for (size_t i = 0; i + 1 < size; ++i) {
       x0 = points[i].x;
       y0 = points[i].y;
       x1 = points[i + 1].x;
       y1 = points[i + 1].y;
       double dy = y1 - y0;
       double dx = x1 - x0;
       output[j++] = {x0, y0};
       output[j++] = {x0 + dx/3, y0 + dy/3};
       output[j++] = {x0 + dx/2 - dy * sqrt3_2/3, y0 + dy/2 + dx * sqrt3_2/3};
       output[j++] = {x0 + 2 * dx/3, y0 + 2 * dy/3};
   }
   output[j] = {x1, y1};
   return output;
}
std::vector<point> koch_points(int size, int iterations) {
   double length = size * sqrt3_2 * 0.95;
   double x = (size - length)/2;
   double y = size/2 - length * sqrt3_2/3;
   std::vector<point> points{
       {x, y},
       {x + length/2, y + length * sqrt3_2},
       {x + length, y},
       {x, y}
   };
   for (int i = 0; i < iterations; ++i)
       points = koch_next(points);
   return points;
}
void koch_curve_svg(std::ostream& out, int size, int iterations) {
   out << "<svg xmlns='http://www.w3.org/2000/svg' width='"
       << size << "' height='" << size << "'>\n";
   out << "<rect width='100%' height='100%' fill='black'/>\n";
   out << "<path stroke-width='1' stroke='white' fill='none' d='";
   auto points(koch_points(size, iterations));
   for (size_t i = 0, n = points.size(); i < n; ++i)
       out << (i == 0 ? "M" : "L") << points[i].x << ',' << points[i].y << '\n';
   out << "z'/>\n</svg>\n";
}
int main() {
   std::ofstream out("koch_curve.svg");
   if (!out) {
       std::cerr << "Cannot open output file\n";
       return EXIT_FAILURE;
   }
   koch_curve_svg(out, 600, 5);
   return EXIT_SUCCESS;
}</lang>
- Output:
See: koch_curve.svg (offsite SVG image)
Factor
The approach taken is to generate a Thue-Morse sequence. Using turtle graphics, move forward for each 0 encountered and rotate 60 degrees for each 1 encountered. Remarkably, this produces a Koch curve. <lang factor>USING: accessors images images.testing images.viewer kernel literals math math.constants math.functions sequences ; IN: rosetta-code.koch-curve
CONSTANT: order 17 CONSTANT: theta 1.047197551196598 ! 60 degrees in radians CONSTANT: move-distance 0.25 CONSTANT: dim { 600 400 } CONSTANT: offset-x 500 CONSTANT: offset-y 300
- <koch-image> ( -- image )
   <rgb-image> dim >>dim
   dim product 3 * [ 255 ] B{ } replicate-as >>bitmap ;
- thue-morse ( n -- seq )
{ 0 } swap [ [ ] [ [ 1 bitxor ] map ] bi append ] times ;
TUPLE: turtle
{ heading initial: 0 } { x initial: 0 } { y initial: 0 } ;
- turn ( turtle -- turtle' )
[ theta + 2pi mod ] change-heading ;
- move ( turtle -- turtle' )
   dup heading>> [ cos move-distance * + ] curry change-x
   dup heading>> [ sin move-distance * + ] curry change-y ;
- step ( turtle elt -- turtle' )
[ move ] [ drop turn ] if-zero ;
- setup-pixel ( turtle -- pixel x y )
   { 0 0 0 } swap [ x>> ] [ y>> ] bi
   [ >integer ] bi@ [ offset-x + ] [ offset-y + ] bi* ;
- koch-curve ( -- )
   <koch-image> turtle new over order thue-morse [
       [ dup setup-pixel ] [ set-pixel-at ] [ step drop ] tri*
   ] 2with each image-window ;
MAIN: koch-curve</lang>
- Output:
![[1]](https://i.imgur.com/MVS8QiS.png)
Forth
<lang>include lib/graphics.4th include lib/math.4th include lib/enter.4th
- (p3&p5) 2* + 3 / ; ( n1 n2 -- n2+n2+n1/3)
- (p3) rot (p3&p5) >r swap (p3&p5) r> ;
- (p5) rot swap (p3&p5) >r (p3&p5) r> ;
- (*/10K) * 10K 2 / + 10K / ; ( n1 n2 -- n1*n2/10000)
- koch ( x1 y1 x2 y2 n --)
 dup 0> if
   1- >r 2over 2over (p5)
   2>r 2over 2over (p3) 2r>           ( x1 y1 x2 y2 x3 y3 x5 y5 )
   PI*10K 3 / >r 2over 2over rot - >r swap - >r ( R: n theta y5-y3 x5-x3)
   2over r@ r"@ (sin) (*/10K) - r'@ r"@ (cos) (*/10K) +
   swap  r@ r"@ (cos) (*/10K) + r'@ r"@ (sin) (*/10K) +
   rdrop rdrop rdrop swap             ( x1 y1 x2 y2 x3 y3 x5 y5 x4 y4 R: n)

   2rot 2>r 2>r 2rot 2r> 2r> 2rot     ( x2 y2 x5 y5 x4 y4 x3 y3 x1 y1 R: n)
   2over r@ recurse                   ( x2 y2 x5 y5 x4 y4 x3 y3 R: n )
   2over r@ recurse                   ( x2 y2 x5 y5 x4 y4 R: n )
   2over r@ recurse                   ( x2 y2 x5 y5 R: n)
   2swap r> recurse                   ( --)
 ;then drop line
600 pic_width ! 600 pic_height ! \ set canvas size color_image 255 whiteout blue \ paint blue on white
." Level (0-4): " enter 0 max 4 min >r
450 100 450 500 r@ koch \ paint the snowflake 115 300 450 100 r@ koch 450 500 115 300 r> koch
s" gkoch.ppm" save_image \ save the image</lang>
FreeBASIC
<lang freebasic> Const Pi = 4 * Atn(1) Const RtoD = 180 / Pi Const DtoR = Pi / 180
Dim Shared As Single posX = 260, posY = 90, angulo = 0
Screen 19 : Color 0,15
Sub kochLado(longitud As Integer, fondo As Integer)
   Dim As Single dx, dy
   If fondo = 0 Then
       dx = Cos(angulo*DtoR) * longitud
       dy = Sin(angulo*DtoR) * longitud
       Line (posX, posY)-(posX+dx, posY+dy), 2
       posX += dx
       posY += dy
   Else
       kochLado(longitud/3.0, fondo-1)
       angulo += 60
       kochLado(longitud/3.0, fondo-1)
       angulo -= 120
       kochLado(longitud/3.0, fondo-1)
       angulo += 60
       kochLado(longitud/3.0, fondo-1)
   End If
End Sub
Sub CopoNieveKoch(longitud As Integer, recursionfondo As Integer)
   For i As Integer = 1 To 6
       kochLado(longitud,recursionfondo)
       angulo -= 300
   Next i
End Sub
For n As Integer = 0 To 5
   Cls
   Locate 3,4: Print "Copo de nieve de Koch"
   Locate 4,4: Print "Iteracion numero: " & n
   CopoNieveKoch(280, n)
   Sleep 800
Next n color 4: Locate 6,4: Print "Pulsa una tecla..." Bsave "Koch_curve.bmp",0 Sleep End </lang>
Go
<lang go>package main
import (
   "github.com/fogleman/gg"
   "math"
)
var dc = gg.NewContext(512, 512)
func koch(x1, y1, x2, y2 float64, iter int) {
   angle := math.Pi / 3 // 60 degrees
   x3 := (x1*2 + x2) / 3
   y3 := (y1*2 + y2) / 3
   x4 := (x1 + x2*2) / 3
   y4 := (y1 + y2*2) / 3
   x5 := x3 + (x4-x3)*math.Cos(angle) + (y4-y3)*math.Sin(angle)
   y5 := y3 - (x4-x3)*math.Sin(angle) + (y4-y3)*math.Cos(angle)
   if iter > 0 {
       iter--
       koch(x1, y1, x3, y3, iter)
       koch(x3, y3, x5, y5, iter)
       koch(x5, y5, x4, y4, iter)
       koch(x4, y4, x2, y2, iter)
   } else {
       dc.LineTo(x1, y1)
       dc.LineTo(x3, y3)
       dc.LineTo(x5, y5)
       dc.LineTo(x4, y4)
       dc.LineTo(x2, y2)
   }
}
func main() {
   dc.SetRGB(1, 1, 1) // White background
   dc.Clear()
   koch(100, 100, 400, 400, 4)
   dc.SetRGB(0, 0, 1) // Blue curve
   dc.SetLineWidth(2)
   dc.Stroke()
   dc.SavePNG("koch.png")
}</lang>
- Output:
Image is similar to Ring entry.
Haskell
Generates SVG for a Koch snowflake. To view, save to a text file with an .svg extension, and open in a browser.
<lang haskell>import Data.Bifunctor (bimap) import Text.Printf (printf)
KOCH CURVE ----------------------
kochSnowflake ::
 Int ->
 (Float, Float) ->
 (Float, Float) ->
 [(Float, Float)]
kochSnowflake n a b =
 concat $
   zipWith (kochCurve n) points (xs <> [x])
 where
   points@(x : xs) = [a, equilateralApex a b, b]
kochCurve ::
 Int ->
 (Float, Float) ->
 (Float, Float) ->
 [(Float, Float)]
kochCurve n ab xy = ab : go n (ab, xy)
 where
   go 0 (_, xy) = [xy]
   go n (ab, xy) =
     let (mp, mq) = midThirdOfLine ab xy
         points@(_ : xs) =
           [ ab,
             mp,
             equilateralApex mp mq,
             mq,
             xy
           ]
      in go (pred n) =<< zip points xs
equilateralApex ::
 (Float, Float) ->
 (Float, Float) ->
 (Float, Float)
equilateralApex = rotatedPoint (pi / 3)
rotatedPoint ::
 Float ->
 (Float, Float) ->
 (Float, Float) ->
 (Float, Float)
rotatedPoint theta (ox, oy) (a, b) = (ox + dx, oy - dy)
 where
   (dx, dy) = rotatedVector theta (a - ox, oy - b)
rotatedVector :: Float -> (Float, Float) -> (Float, Float) rotatedVector angle (x, y) =
 ( x * cos angle - y * sin angle,
   x * sin angle + y * cos angle
 )
midThirdOfLine ::
 (Float, Float) ->
 (Float, Float) ->
 ((Float, Float), (Float, Float))
midThirdOfLine (a, b) (x, y) = (p, f p)
 where
   (dx, dy) = ((x - a) / 3, (y - b) / 3)
   f = bimap (dx +) (dy +)
   p = f (a, b)
TEST ---------------------------
main :: IO () main =
 putStrLn $
   svgFromPoints 1024 $
     kochSnowflake 4 (200, 600) (800, 600)
SVG ----------------------------
svgFromPoints :: Int -> [(Float, Float)] -> String svgFromPoints w xys =
 unlines
   [ "<svg xmlns=\"http://www.w3.org/2000/svg\"",
     unwords
       [ "width=\"512\" height=\"512\" viewBox=\"5 5",
         sw,
         sw,
         "\"> "
       ],
     "<path d=\"M" <> points <> "\" ",
     unwords [
       "stroke-width=\"2\"",
       "stroke=\"red\"",
       "fill=\"transparent\"/>"
     ],
     "</svg>"
   ]
 where
   sw = show w
   showN = printf "%.2g"
   points =
     ( unwords
         . fmap
           ( ((<>) . showN . fst)
               <*> ((' ' :) . showN . snd)
           )
     )
       xys</lang>
IS-BASIC
<lang IS-BASIC>100 PROGRAM "Koch.bas" 110 OPTION ANGLE DEGREES 120 SET 22,1:SET 23,0:SET 24,42:SET 25,26 130 OPEN #101:"video:" 140 DISPLAY #101:AT 1 FROM 1 TO 26 150 SET PALETTE 0,252 160 PLOT 300,700;ANGLE 0; 170 FOR I=1 TO 3 180 CALL KOCH(0,800) 190 PLOT RIGHT 120; 200 NEXT 210 DEF KOCH(A,D) 220 IF D>12 THEN 230 LET D=D/3 240 CALL KOCH(A,D) 250 CALL KOCH(60,D) 260 CALL KOCH(-120,D) 270 CALL KOCH(60,D) 280 ELSE 290 PLOT LEFT A;FORWARD D; 300 END IF 310 END DEF</lang>
J
<lang J>seg=: [ + [: +/\ (0,1r3*1,(^j.(,-)_2 o.1r2),1) * -~ koch=: [: ,/ 2 seg/\ ]
require'plot' tri=: ^ j. 4r3 * (_2 o. 0) * i._4 plot koch ^: 5 tri</lang>
The idea is to continually expand the segments between a list of points in the complex plane. Given consecutive x and y in the list, v = (y-x)/3 is a vector representing 1/3 of the trip from x to y. An iteration building the Koch curve starts at x, advances by v, advances by v rotated by 60 degrees, advances by v rotated -60 degrees, and finally advances by another v, reaching y. x seg y produces this expansion. koch takes a list of points and expands segments between consecutive ones, producing another list. koch ^: 5 does this 5 times, and plot shows the snowflake in a window.
JavaScript
Generates SVG. To view, save to a file with the extension '.svg', and open in a browser.
<lang javascript>(() => {
'use strict';
   // kochSnowflake :: Int -> (Float, Float) -> (Float, Float)
   //                      -> [(Float, Float)]
   const kochSnowflake = n => a => b => {
       // List of points on a Koch snowflake of order n, derived
       // from an equilateral triangle with base a b.
       const points = [a, equilateralApex(a)(b), b];
       return concat(
           zipWith(kochCurve(n))(points)(
               points.slice(1).concat([points[0]])
           )
       );
   };
   // koch :: Int -> (Float, Float) -> (Float, Float)
   //             -> [(Float, Float)]
   const kochCurve = n => ab => xy => {
       // A Koch curve of order N, starting at the point
       // (a, b), and ending at the point (x, y).
       const go = n => ([ab, xy]) =>
           0 !== n ? (() => {
               const [mp, mq] = midThirdOfLine(ab)(xy);
               const points = [
                   ab,
                   mp,
                   equilateralApex(mp)(mq),
                   mq,
                   xy
               ];
               return zip(points)(points.slice(1))
                   .flatMap(go(n - 1))
           })() : [xy];
       return [ab].concat(go(n)([ab, xy]));
   };
   // equilateralApex :: (Float, Float) -> (Float, Float) -> (Float, Float)
   const equilateralApex = p => q =>
       rotatedPoint(Math.PI / 3)(p)(q);
   // rotatedPoint :: Float -> (Float, Float) ->
   //        (Float, Float) -> (Float, Float)
   const rotatedPoint = theta => ([ox, oy]) => ([a, b]) => {
       // The point ab rotated theta radians
       // around the origin xy.
       const [dx, dy] = rotatedVector(theta)(
           [a - ox, oy - b]
       );
       return [ox + dx, oy - dy];
   };
   // rotatedVector :: Float -> (Float, Float) -> (Float, Float)
   const rotatedVector = theta => ([x, y]) =>
       // The vector xy rotated by theta radians.
       [
           x * Math.cos(theta) - y * Math.sin(theta),
           x * Math.sin(theta) + y * Math.cos(theta)
       ];
   // midThirdOfLine :: (Float, Float) -> (Float, Float)
   //                 -> ((Float, Float), (Float, Float))
   const midThirdOfLine = ab => xy => {
       // Second of three equal segments of
       // the line between ab and xy.
       const
           vector = zipWith(dx => x => (dx - x) / 3)(xy)(ab),
           f = zipWith(add)(vector),
           p = f(ab);
       return [p, f(p)];
   };
   // TEST -----------------------------------------------
   // main :: IO ()
   const main = () =>
       // SVG showing a Koch snowflake of order 4.
       console.log(
           svgFromPoints(1024)(
               kochSnowflake(5)(
                   [200, 600]
               )([800, 600])
           )
       );
// SVG ----------------------------------------------
   // svgFromPoints :: Int -> [(Int, Int)] -> String
   const svgFromPoints = w => ps => [
       '<svg xmlns="http://www.w3.org/2000/svg"',
       `width="500" height="500" viewBox="5 5 ${w} ${w}">`,
       `<path d="M${
       ps.flatMap(p => p.map(n => n.toFixed(2))).join(' ')
   }" `,
       'stroke-width="2" stroke="red" fill="transparent"/>',
       '</svg>'
   ].join('\n');
// GENERIC --------------------------------------------
   // add :: Num -> Num -> Num
   const add = a => b => a + b;
   // concat :: a -> [a]
   const concat = xs => [].concat.apply([], xs);
   // zip :: [a] -> [b] -> [(a, b)]
   const zip = xs => ys =>
       xs.slice(
           0, Math.min(xs.length, ys.length)
       ).map((x, i) => [x, ys[i]]);
   // zipWith :: (a -> b -> c) -> [a] -> [b] -> [c]
   const zipWith = f => xs => ys =>
       xs.slice(
           0, Math.min(xs.length, ys.length)
       ).map((x, i) => f(x)(ys[i]));
   // MAIN ---
   return main();
})();</lang>
jq
Works with gojq, the Go implementation of jq
This entry uses an L-system and turtle graphics to generate an SVG file which can be viewed using a web browser, at least if the file type is `.svg`.
See Category_talk:Jq-turtle for the turtle.jq module used here. Please note that the `include` directive may need to be modified depending on the location of the included file, and the command-line options used. <lang jq>include "turtle" {search: "."};
def rules:
  { F:  "F+F--F+F",
    "": "F--F--F"  };
def koch($count):
 rules as $rules
 | def repeat($count):
     if $count <= 0 then .
     else gsub("F"; $rules["F"])
     | repeat($count-1)
     end;
 $rules[""] | repeat($count) ;
def interpret($x):
 if   $x == "+" then turtleRotate(60)
 elif $x == "-" then turtleRotate(-60)
 elif $x == "F" then turtleForward(4)
 else .
 end;
def koch_curve($n):
 koch($n)
 | split("")
 | reduce .[] as $action (turtle([0,300]) | turtleDown;
     interpret($action) ) ;
koch_curve(5) | draw(1200)</lang>
Julia
Multiple snowflake plots. Copied from https://www.juliabloggers.com/koch-snowflakes-for-the-holidays/. <lang Julia>using Plots
function pointskoch(points, maxk, α = sqrt(3)/2)
 Q = [0 -1; 1 0]
 for k = 1:maxk
   n = length(points)
   new_points = Vector{Float64}[]
   for i = 1:n-1
     p1, p2 = points[i], points[i+1]
     v = (p2 - p1) / 3
     q1 = p1 + v
     q2 = p1 + 1.5v + α * Q * v
     q3 = q1 + v
     append!(new_points, [p1, q1, q2, q3])
   end
   push!(new_points, points[end])
   points = new_points
 end
 return points
end
function plot_koch(points; c=:red, kwargs...)
 n = length(points)
 plot(leg=false, axis=false, grid=false, background=:white)
 px = [p[1] for p in points]
 py = [p[2] for p in points]
 plot!(px, py, c=c; kwargs...)
end
function plot_koch!(points; c=:red, kwargs...)
 n = length(points)
 px = [p[1] for p in points]
 py = [p[2] for p in points]
 plot!(px, py, c=c; kwargs...)
end
function main()
 pyplot(size=(600,300))
 points = [[0.0; 0.0], [1.0; 0.0]]
 for k = 0:7
   new_points = pointskoch(points, k)
   plot_koch(new_points)
   ylims!(-0.1, 0.4)
   png("line-koch-$k")
 end
 pyplot(size=(200,200))
 for N = 2:8
   points = [[sin(2π*i/N), cos(2π*i/N)] for i = 0:N]
   plot_koch(points, c=:blue)
   points = pointskoch(points, 6)
   plot_koch!(points)
   xlims!(-1.5, 1.5)
   ylims!(-1.5, 1.5)
   png("polygon-$N")
   points = [[sin(2π*i/N), cos(2π*i/N)] for i = N:-1:0]
   plot_koch(points, c=:blue)
   points = pointskoch(points, 6)
   plot_koch!(points)
   xlims!(-1.5, 1.5)
   ylims!(-1.5, 1.5)
   png("polygon-reverse-$N")
   if N > 2
     points = [[sin(2π*i/N), cos(2π*i/N)] for i = N:-1:0]
     α = 0.85 / tan(π / N)
     α = 3 * sqrt(N) / 5
     points = pointskoch(points, 5, α)
     plot_koch(points)
     xlims!(-1.5, 1.5)
     ylims!(-1.5, 1.5)
     png("stargon-$N")
   end
 end
 # [1.5,  1.2,  0.96, 0.85
 # [√3/2, 1.2,  1.32, 1.47
 maxk = 5
 points = [[sin(2π*i/3), cos(2π*i/3)] for i = 3:-1:0]
 points = pointskoch(points, maxk)
 plot_koch(points)
 xlims!(-1.1, 1.1)
 ylims!(-0.9, 1.3)
 png("reverse-koch")
 N = 4
 points = [[cos(2π*i/N), sin(2π*i/N)] for i = 0:N]
 points = pointskoch(points, maxk, 1.25)
 plot_koch(points)
 png("star")
 points = [[0.0; 0.0], [1.0; 0.0], [1.0; 1.0], [0.0; 1.0], [0.0; 0.0]]
 points = pointskoch(points, maxk, 1.2)
 plot_koch(points)
 png("reverse-star")
 for N = 3:5
   points = [[cos(2π*i/N), sin(2π*i/N)] for i = 1:N]
   points = [i % 2 == 0 ? zeros(2) : points[div(i, 2) + 1] for i = 0:2N]
   points = pointskoch(points, 5, 1.0)
   plot_koch(points)
   xlims!(-1.2, 1.2)
   ylims!(-1.2, 1.2)
   png("tri-$N")
 end
 N = 3
 points = [[sin(2π*i/N), cos(2π*i/N)] for i = 0:N]
 points = pointskoch(points, maxk)
 plot_koch(points)
 α = 0.6
 plot_koch!(α^2 * points)
 plot_koch!(α^4 * points)
 points = [[y,x] for (x,y) in points]
 plot_koch!(α * points, c=:green)
 plot_koch!(α^3 * points, c=:green)
 png("koch")
run(`montage tri-3.png koch.png tri-4.png tri-5.png reverse-star.png star.png -geometry +2+2 background.jpg`)
end
function large_koch()
 pyplot(size=(2000,2000))
 N = 3
 points = [[sin(2π*i/N), cos(2π*i/N)] for i = 0:N]
 points = pointskoch(points, 1)
 plot_koch(points)
 α = 3/sqrt(3)
 maxp = 11
 for p = 1:maxp
   points = α * [[-y;x] for (x,y) in points]
   if p < 7
     points = pointskoch(points, 1)
   end
   plot_koch!(points, c=p%2==1 ? :green : :red)
   xlims!(-1.1α^p, 1.1α^p)
   ylims!(-1.1α^p, 1.1α^p)
   png("koch-large-sub-$p")
 end
 xlims!(-1.1α^maxp, 1.1α^maxp)
 ylims!(-1.1α^maxp, 1.1α^maxp)
 png("koch-large")
end
function koch_julia()
 colors = [RGB(0.584, 0.345, 0.698)  RGB(0.667, 0.475, 0.757);
           RGB(0.220, 0.596, 0.149)  RGB(0.376, 0.678, 0.318);
           RGB(0.796, 0.235, 0.200)  RGB(0.835, 0.388, 0.361)]
 plot()
 plot_koch([])
 α = sqrt(3)/3
 for (i,θ) in enumerate([2π*i/3 for i = 0:2])
   points = [[sin(2π*i/3), cos(2π*i/3)] for i = 0:3]
   points = pointskoch(points, 6)
   plot_koch!([[sin(θ) + x; cos(θ) + y] for (x,y) in points], c=colors[i,1], lw=2)
   for p = 1:8
     points = α * [[-y; x] for (x,y) in points]
     plot_koch!([[sin(θ) + x; cos(θ) + y] for (x,y) in points], c=colors[i,p%2+1], lw=2)
   end
 end
 xlims!(-2.1, 2.1)
 ylims!(-1.9, 2.3)
 png("koch-julia")
end
- main()
- large_koch()
koch_julia() </lang>
Kotlin
This incorporates code from other relevant tasks in order to provide a runnable example. The image produced is saved to disk where it can be viewed with a utility such as EOG. <lang scala>// Version 1.2.41
import java.awt.Color import java.awt.Graphics import java.awt.image.BufferedImage import kotlin.math.* import java.io.File import javax.imageio.ImageIO
val Double.asI get() = this.toInt()
class Point(var x: Int, var y: Int)
class BasicBitmapStorage(width: Int, height: Int) {
val image = BufferedImage(width, height, BufferedImage.TYPE_3BYTE_BGR)
   fun fill(c: Color) {
       val g = image.graphics
       g.color = c
       g.fillRect(0, 0, image.width, image.height)
   }
fun setPixel(x: Int, y: Int, c: Color) = image.setRGB(x, y, c.getRGB())
fun getPixel(x: Int, y: Int) = Color(image.getRGB(x, y))
   fun drawLine(x0: Int, y0: Int, x1: Int, y1: Int, c: Color) {
       val dx = abs(x1 - x0)
       val dy = abs(y1 - y0)
       val sx = if (x0 < x1) 1 else -1
       val sy = if (y0 < y1) 1 else -1
       var xx = x0
       var yy = y0
       var e1 = (if (dx > dy) dx else -dy) / 2
       var e2: Int
       while (true) {
           setPixel(xx, yy, c)
           if (xx == x1 && yy == y1) break
           e2 = e1
           if (e2 > -dx) { e1 -= dy; xx += sx }
           if (e2 <  dy) { e1 += dx; yy += sy }
       }
   }
   fun koch(x1: Double, y1: Double, x2: Double, y2: Double, it: Int) {
       val angle = PI / 3.0  // 60 degrees
       val clr = Color.blue
       var iter = it
       val x3 = (x1 * 2.0 + x2) / 3.0
       val y3 = (y1 * 2.0 + y2) / 3.0
       val x4 = (x1 + x2 * 2.0) / 3.0
       val y4 = (y1 + y2 * 2.0) / 3.0
       val x5 = x3 + (x4 - x3) * cos(angle) + (y4 - y3) * sin(angle)
       val y5 = y3 - (x4 - x3) * sin(angle) + (y4 - y3) * cos(angle)
       if (iter > 0) {
           iter--
           koch(x1, y1, x3, y3, iter)
           koch(x3, y3, x5, y5, iter)
           koch(x5, y5, x4, y4, iter)
           koch(x4, y4, x2, y2, iter)
        }
        else {
           drawLine(x1.asI, y1.asI, x3.asI, y3.asI, clr)
           drawLine(x3.asI, y3.asI, x5.asI, y5.asI, clr)
           drawLine(x5.asI, y5.asI, x4.asI, y4.asI, clr)
           drawLine(x4.asI, y4.asI, x2.asI, y2.asI, clr)
        }
   }
}
fun main(args: Array<String>) {
   val width = 512
   val height = 512
   val bbs = BasicBitmapStorage(width, height)
   with (bbs) {
       fill(Color.white)
       koch(100.0, 100.0, 400.0, 400.0, 4)
       val kFile = File("koch_curve.jpg")
       ImageIO.write(image, "jpg", kFile)
   }
}</lang>
- Output:
Image is similar to Ring entry.
Lambdatalk
<lang scheme> {def koch
{lambda {:d :n}
 {if {< :n 1}
  then M:d
  else {koch {/ :d 3} {- :n 1}} T-60
       {koch {/ :d 3} {- :n 1}} T120
       {koch {/ :d 3} {- :n 1}} T-60
       {koch {/ :d 3} {- :n 1}} }}}
-> koch
{def K {koch 300 4}} -> K
{svg {@ width="580" height="580" style="box-shadow:0 0 8px #000;"}
{polyline  {@ points="{turtle 140 140 0 {K}}"
              stroke="#f00" fill="transparent"}}
{polyline  {@ points="{turtle 140 440 90 {K}}"
              stroke="#0f0" fill="transparent"}}
{polyline  {@ points="{turtle 440 440 180 {K}}"
              stroke="#00f" fill="transparent"}}
{polyline  {@ points="{turtle 440 140 270 {K}}"
              stroke="#ff0" fill="transparent"}}
}
The output is a "square of Koch" which can be seen in http://lambdaway.free.fr/lambdawalks/?view=koch </lang>
Logo
<lang > to ff :l :i cs right 90 pd pr [lenght] show form :l 4 0 pr [iterations] show form :i 4 0 koch :l :i end
to koch :len :iterations ifelse :iterations = 1 [fd :len] [ koch :len :iterations - 1 left 60 koch :len :iterations - 1 right 120 koch :len :iterations - 1 left 60 koch :len :iterations - 1] end
to zzz ifelse YesNoBox [Welcome] [YES=run it, NO=show me the code] [ff 22 3] [edall] end
Make "startup [zzz] </lang>
Lua
Using the Bitmap class here, with an ASCII pixel representation, then extending with line() as here, then extending further..
<lang lua>local cos, sin, floor, pi = math.cos, math.sin, math.floor, math.pi
function Bitmap:render()
 for y = 1, self.height do
   print(table.concat(self.pixels[y]))
 end
end
function Bitmap:drawKochPath(path, x, y, angle, speed, color)
 local rules = {
   ["+"] = function() angle = angle + pi/3 end,
   ["-"] = function() angle = angle - pi/3 end,
   ["F"] = function()
     local nx, ny = x+speed*cos(angle), y+speed*sin(angle)
     self:line(floor(x*2+0.5), floor(y+0.5), floor(nx*2+0.5), floor(ny+0.5), color)
     x, y = nx, ny
   end
 }
 path:gsub("(.)", function(c) rules[c]() end)
end
function LSystem(axiom, rules, reps)
 for i = 1, reps do
   axiom = axiom:gsub("(.)", function(c) return rules[c] or c end)
 end
 return axiom
end function KochPath(reps) return LSystem("F--F--F--", { F = "F+F--F+F" }, reps) end
demos = {
 { n=0, w= 11, h= 6, x=1, y= 4 },
 { n=1, w= 22, h=14, x=1, y= 9 },
 { n=2, w= 60, h=34, x=1, y=24 },
 { n=3, w=168, h=96, x=1, y=71 }
} for _,d in ipairs(demos) do
 bitmap = Bitmap(d.w, d.h)
 bitmap:clear(".")
 bitmap:drawKochPath(KochPath(d.n), d.x, d.y, 0, 3, "@")
 bitmap:render()
 print()
end</lang>
- Output:
...........
.....@.....
....@.@....
...@...@...
..@@@@@@@..
...........

......................
...........@..........
..........@.@.........
.........@...@........
..@@@@@@@.....@@@@@@@.
...@..............@...
....@@...........@....
....@.............@...
...@...............@..
..@@@@@@@.....@@@@@@@.
.........@...@........
..........@.@.........
...........@..........
......................

............................................................
.............................@@.............................
............................@..@............................
....................@@@@@@@@....@@@@@@@.....................
.....................@...............@......................
......................@.............@.......................
...........@@..........@...........@@..........@@...........
..........@..@........@..............@........@..@..........
..@@@@@@@@....@@@@@@@@................@@@@@@@@....@@@@@@@...
...@...................................................@....
....@.................................................@.....
.....@...............................................@......
....@.................................................@.....
...@...................................................@....
..@@@@@@@........................................@@@@@@@@...
.........@......................................@...........
..........@@...................................@............
..........@.....................................@...........
.........@.......................................@..........
..@@@@@@@.........................................@@@@@@@...
...@..................................................@.....
....@@...............................................@......
....@.................................................@.....
...@...................................................@....
..@@@@@@@.....@@@@@@@.................@@@@@@@.....@@@@@@@...
.........@...@.......@...............@.......@...@..........
..........@.@.........@.............@.........@.@...........
...........@...........@...........@@..........@............
......................@..............@......................
....................@@@@@@@.....@@@@@@@.....................
...........................@...@............................
............................@.@.............................
.............................@..............................
............................................................

........................................................................................................................................................................
...................................................................................@@...................................................................................
..................................................................................@..@..................................................................................
..........................................................................@@@@@@@@....@@@@@@@...........................................................................
...........................................................................@...............@............................................................................
............................................................................@.............@.............................................................................
.................................................................@...........@...........@...........@..................................................................
................................................................@.@.........@.............@.........@.@.................................................................
...............................................................@...@.......@...............@.......@...@................................................................
........................................................@@@@@@@.....@@@@@@@.................@@@@@@@.....@@@@@@@.........................................................
.........................................................@..................................................@...........................................................
..........................................................@@...............................................@............................................................
..........................................................@.................................................@...........................................................
.........................................................@...................................................@..........................................................
........................................................@@@@@@@........................................@@@@@@@@.........................................................
...............................................................@......................................@.................................................................
.............................@..................................@@...................................@...................................@..............................
............................@.@.................................@.....................................@.................................@.@.............................
...........................@...@...............................@.......................................@...............................@...@............................
....................@@@@@@@.....@@@@@@@.................@@@@@@@.........................................@@@@@@@.................@@@@@@@.....@@@@@@@.....................
.....................@...............@...................@...................................................@...................@...............@......................
......................@.............@.....................@.................................................@.....................@.............@.......................
...........@@..........@...........@@..........@@..........@...............................................@@..........@@..........@...........@@..........@@...........
..........@..@........@..............@........@..@........@..................................................@........@..@........@..............@........@..@..........
..@@@@@@@@....@@@@@@@@................@@@@@@@@....@@@@@@@@....................................................@@@@@@@@....@@@@@@@@................@@@@@@@@....@@@@@@@...
...@...............................................................................................................................................................@....
....@.............................................................................................................................................................@.....
.....@...........................................................................................................................................................@@.....
....@..............................................................................................................................................................@....
..@@@@@@@.....................................................................................................................................................@@@@@@@...
.........@...................................................................................................................................................@..........
..........@.................................................................................................................................................@...........
...........@...............................................................................................................................................@............
..........@.................................................................................................................................................@...........
.........@...................................................................................................................................................@..........
..@@@@@@@.....................................................................................................................................................@@@@@@@...
...@..............................................................................................................................................................@.....
....@@...........................................................................................................................................................@......
....@.............................................................................................................................................................@.....
...@...............................................................................................................................................................@....
..@@@@@@@....@@@@@@@@............................................................................................................................@@@@@@@@....@@@@@@@@...
.........@..@........@..........................................................................................................................@........@..@...........
..........@@..........@@.......................................................................................................................@..........@@............
......................@.........................................................................................................................@.......................
.....................@...........................................................................................................................@......................
....................@@@@@@@.................................................................................................................@@@@@@@.....................
...........................@...............................................................................................................@............................
............................@.............................................................................................................@.............................
.............................@...........................................................................................................@@.............................
............................@..............................................................................................................@............................
....................@@@@@@@@................................................................................................................@@@@@@@.....................
.....................@...........................................................................................................................@......................
......................@.........................................................................................................................@.......................
...........@@..........@.......................................................................................................................@@..........@@...........
..........@..@........@..........................................................................................................................@........@..@..........
..@@@@@@@@....@@@@@@@@............................................................................................................................@@@@@@@@....@@@@@@@...
...@...............................................................................................................................................................@....
....@.............................................................................................................................................................@.....
.....@...........................................................................................................................................................@......
....@.............................................................................................................................................................@.....
...@...............................................................................................................................................................@....
..@@@@@@@....................................................................................................................................................@@@@@@@@...
.........@..................................................................................................................................................@...........
..........@@...............................................................................................................................................@............
..........@.................................................................................................................................................@...........
.........@...................................................................................................................................................@..........
..@@@@@@@.....................................................................................................................................................@@@@@@@...
...@..............................................................................................................................................................@.....
....@@...........................................................................................................................................................@......
....@.............................................................................................................................................................@.....
...@...............................................................................................................................................................@....
..@@@@@@@.....@@@@@@@.................@@@@@@@.....@@@@@@@.....................................................@@@@@@@.....@@@@@@@.................@@@@@@@.....@@@@@@@...
.........@...@.......@...............@.......@...@.......@...................................................@.......@...@.......@...............@.......@...@..........
..........@.@.........@.............@.........@.@.........@.................................................@.........@.@.........@.............@.........@.@...........
...........@...........@...........@@..........@...........@...............................................@@..........@...........@...........@@..........@............
......................@..............@....................@..................................................@....................@..............@......................
....................@@@@@@@.....@@@@@@@.................@@@@@@@.........................................@@@@@@@.................@@@@@@@.....@@@@@@@.....................
...........................@...@...............................@.......................................@...............................@...@............................
............................@.@.................................@.....................................@.................................@.@.............................
.............................@...................................@...................................@@..................................@..............................
................................................................@......................................@................................................................
........................................................@@@@@@@@........................................@@@@@@@.........................................................
.........................................................@...................................................@..........................................................
..........................................................@.................................................@...........................................................
...........................................................@...............................................@............................................................
..........................................................@.................................................@...........................................................
.........................................................@...................................................@..........................................................
........................................................@@@@@@@....@@@@@@@@................@@@@@@@@....@@@@@@@@.........................................................
...............................................................@..@........@..............@........@..@.................................................................
................................................................@@..........@@...........@..........@@..................................................................
............................................................................@.............@.............................................................................
...........................................................................@...............@............................................................................
..........................................................................@@@@@@@....@@@@@@@@...........................................................................
.................................................................................@..@...................................................................................
..................................................................................@@....................................................................................
........................................................................................................................................................................
Mathematica/Wolfram Language
<lang mathematica>Graphics[{GeometricTransformation[KochCurve[5], RotationTransform[Pi, {0.5, 0}]],
 GeometricTransformation[KochCurve[5], RotationTransform[-Pi/3, {1, 0}]],
 GeometricTransformation[KochCurve[5], RotationTransform[Pi/3, {0, 0}]]}]</lang>
Nim
<lang nim> from math import sin, cos, PI import libgd
const
 width = 512
 height = 512
 iterations = 4
proc kochCurve(img: gdImagePtr, x1, y1, x2, y2: float, iter: int): void =
 let angle = PI / 3 # 60 degrees
 let x3 = (x1 * 2 + x2) / 3
 let y3 = (y1 * 2 + y2) / 3
 let x4 = (x1 + x2 * 2) / 3
 let y4 = (y1 + y2 * 2) / 3
 let x5 = x3 + (x4 - x3) * cos(angle) + (y4 - y3) * sin(angle)
 let y5 = y3 - (x4 - x3) * sin(angle) + (y4 - y3) * cos(angle)
 if iter > 0:
   img.kochCurve(x1, y1, x3, y3, iter - 1)
   img.kochCurve(x3, y3, x5, y5, iter - 1)
   img.kochCurve(x5, y5, x4, y4, iter - 1)
   img.kochCurve(x4, y4, x2, y2, iter - 1)
 else:
   img.drawLine(startPoint=[x1.int, y1.int], endPoint=[x3.int, y3.int])
   img.drawLine(startPoint=[x3.int, y3.int], endPoint=[x5.int, y5.int])
   img.drawLine(startPoint=[x5.int, y5.int], endPoint=[x4.int, y4.int])
   img.drawLine(startPoint=[x4.int, y4.int], endPoint=[x2.int, y2.int])
proc main() =
 withGd imageCreate(width, height) as img:
   let white = img.backgroundColor(0xffffff)
   let red = img.foregroundColor(0xff0000)
img.kochCurve(100, 100, 400, 400, iterations)
   let png_out = open("koch_curve.png", fmWrite)
   img.writePng(png_out)
   png_out.close()
main() </lang>
Perl
<lang perl>use SVG; use List::Util qw(max min);
use constant pi => 2 * atan2(1, 0);
- Compute the curve with a Lindemayer-system
my $koch = 'F--F--F'; $koch =~ s/F/F+F--F+F/g for 1..5;
- Draw the curve in SVG
($x, $y) = (0, 0); $theta = pi/3; $r = 2;
for (split //, $koch) {
   if (/F/) {
       push @X, sprintf "%.0f", $x;
       push @Y, sprintf "%.0f", $y;
       $x += $r * cos($theta);
       $y += $r * sin($theta);
   }
   elsif (/\+/) { $theta += pi/3; }
   elsif (/\-/) { $theta -= pi/3; }
}
$xrng = max(@X) - min(@X); $yrng = max(@Y) - min(@Y); $xt = -min(@X)+10; $yt = -min(@Y)+10; $svg = SVG->new(width=>$xrng+20, height=>$yrng+20); $points = $svg->get_path(x=>\@X, y=>\@Y, -type=>'polyline'); $svg->rect(width=>"100%", height=>"100%", style=>{'fill'=>'black'}); $svg->polyline(%$points, style=>{'stroke'=>'orange', 'stroke-width'=>1}, transform=>"translate($xt,$yt)");
open $fh, '>', 'koch_curve.svg'; print $fh $svg->xmlify(-namespace=>'svg'); close $fh;</lang> Koch curve (offsite image)
Phix
You can run this online here.
--
-- demo\rosetta\Koch_curve.exw
-- ===========================
--
with javascript_semantics
include pGUI.e

Ihandle dlg, canvas
cdCanvas cddbuffer, cdcanvas

integer ox = 0, oy = 0

procedure koch(atom x1, y1, x2, y2, integer iter)
    atom angle = -PI/3, -- -60 degrees
         x3 := (x1*2 + x2) / 3,
         y3 := (y1*2 + y2) / 3,
         x4 := (x1 + x2*2) / 3,
         y4 := (y1 + y2*2) / 3,
         x5 := x3 + (x4-x3)*cos(angle) + (y4-y3)*sin(angle),
         y5 := y3 - (x4-x3)*sin(angle) + (y4-y3)*cos(angle)
    if iter>0  then
        iter -= 1
        koch(x1, y1, x3, y3, iter)
        koch(x3, y3, x5, y5, iter)
        koch(x5, y5, x4, y4, iter)
        koch(x4, y4, x2, y2, iter)
    else
        cdCanvasVertex(cddbuffer, x1+ox, y1+oy)
        cdCanvasVertex(cddbuffer, x3+ox, y3+oy)
        cdCanvasVertex(cddbuffer, x5+ox, y5+oy)
        cdCanvasVertex(cddbuffer, x4+ox, y4+oy)
        cdCanvasVertex(cddbuffer, x2+ox, y2+oy)
    end if
end procedure

function redraw_cb(Ihandle /*ih*/, integer /*posx*/, /*posy*/)
    atom {w,h} = IupGetIntInt(canvas, "DRAWSIZE")
    if w>h then ox = floor((w-h)/2); w=h
           else oy = floor((h-w)/2); h=w end if
    atom {x,y} = {w*0.05+w/6,h*0.05+h/4}
    {w,h} = {w*0.6,h*0.6}
    cdCanvasActivate(cddbuffer)
    cdCanvasBegin(cddbuffer, CD_OPEN_LINES)
    koch(x,y,x+w/2,y+h,4)
    koch(x+w/2,y+h,x+w,y,4)
    koch(x+w,y,x,y,4)
    cdCanvasEnd(cddbuffer)
    cdCanvasFlush(cddbuffer)
    return IUP_DEFAULT
end function

function map_cb(Ihandle ih)
    cdcanvas = cdCreateCanvas(CD_IUP, ih)
    cddbuffer = cdCreateCanvas(CD_DBUFFER, cdcanvas)
    cdCanvasSetBackground(cddbuffer, CD_WHITE)
    cdCanvasSetForeground(cddbuffer, CD_BLUE)
    return IUP_DEFAULT
end function

procedure main()
    IupOpen()

    canvas = IupCanvas("RASTERSIZE=512x512")
    IupSetCallbacks(canvas, {"MAP_CB", Icallback("map_cb"),
                             "ACTION", Icallback("redraw_cb")})

    dlg = IupDialog(canvas,`TITLE="Koch curve"`)

    IupShow(dlg)
    IupSetAttribute(canvas, "RASTERSIZE", NULL) -- release the minimum limitation
    if platform()!=JS then
        IupMainLoop()
        IupClose()
    end if
end procedure

main()
Processing
<lang java>int l = 300;
void setup() {
 size(400, 400);
 background(0, 0, 255);
 stroke(255);
 // draw from center of screen
 translate(width/2.0, height/2.0);
 // center curve from lower-left corner of base equilateral triangle
 translate(-l/2.0, l*sqrt(3)/6.0);
 for (int i = 1; i <= 3; i++) {
   kcurve(0, l);
   rotate(radians(120));
   translate(-l, 0);
 }
}
void kcurve(float x1, float x2) {
 float s = (x2-x1)/3;
 if (s < 5) {
   pushMatrix();
   translate(x1, 0);
   line(0, 0, s, 0);
   line(2*s, 0, 3*s, 0);
   translate(s, 0);
   rotate(radians(60));
   line(0, 0, s, 0);
   translate(s, 0);
   rotate(radians(-120));
   line(0, 0, s, 0);
   popMatrix();
   return;
 }
 pushMatrix();
 translate(x1, 0);
 kcurve(0, s);
 kcurve(2*s, 3*s);
 translate(s, 0);
 rotate(radians(60));
 kcurve(0, s);
 translate(s, 0);
 rotate(radians(-120));
 kcurve(0, s);
 popMatrix();
}</lang>The sketch can be run online :
here.
Processing Python mode
<lang python>l = 300
def setup():
   size(400, 400)
   background(0, 0, 255)
   stroke(255)
   # draw from center of screen
   translate(width / 2.0, height / 2.0)
   # center curve from lower - left corner of base equilateral triangle
   translate(-l / 2.0, l * sqrt(3) / 6.0)
   for i in range(4):
       kcurve(0, l)
       rotate(radians(120))
       translate(-l, 0)
def kcurve(x1, x2):
   s = (x2 - x1) / 3.0
   if s < 5:
       pushMatrix()
       translate(x1, 0)
       line(0, 0, s, 0)
       line(2 * s, 0, 3 * s, 0)
       translate(s, 0)
       rotate(radians(60))
       line(0, 0, s, 0)
       translate(s, 0)
       rotate(radians(-120))
       line(0, 0, s, 0)
       popMatrix()
       return
   pushMatrix()
   translate(x1, 0)
   kcurve(0, s)
   kcurve(2 * s, 3 * s)
   translate(s, 0)
   rotate(radians(60))
   kcurve(0, s)
   translate(s, 0)
   rotate(radians(-120))
   kcurve(0, s)
   popMatrix()</lang>
Prolog
Produces an SVG file showing a Koch snowflake. <lang prolog>main:-
write_koch_snowflake('koch_snowflake.svg').
write_koch_snowflake(File):-
   open(File, write, Stream),
   koch_snowflake(Stream, 600, 5),
   close(Stream).
koch_snowflake(Stream, Size, N):-
   format(Stream, "<svg xmlns='http://www.w3.org/2000/svg' width='~d' height='~d'>\n",
          [Size, Size]),
   write(Stream, "<rect width='100%' height='100%' fill='black'/>\n"),
   write(Stream, "<path stroke-width='1' stroke='white' fill='none' d='"),
   Sqrt3_2 = 0.86602540378444,
   Length is Size * Sqrt3_2 * 0.95,
   X0 is (Size - Length)/2,
   Y0 is Size/2 - Length * Sqrt3_2/3,
   X1 is X0 + Length/2,
   Y1 is Y0 + Length * Sqrt3_2,
   X2 is X0 + Length,
   format(Stream, 'M ~g,~g ', [X0, Y0]),
   koch_curve(Stream, X0, Y0, X1, Y1, N),
   koch_curve(Stream, X1, Y1, X2, Y0, N),
   koch_curve(Stream, X2, Y0, X0, Y0, N),
   write(Stream, "z'/>\n</svg>\n").
koch_curve(Stream, _, _, X1, Y1, 0):-
   !,
   format(Stream, 'L ~g,~g\n', [X1, Y1]).
koch_curve(Stream, X0, Y0, X1, Y1, N):-
   N > 0,
   Sqrt3_2 = 0.86602540378444,
   N1 is N - 1,
   Dx is X1 - X0,
   Dy is Y1 - Y0,
   X2 is X0 + Dx/3,
   Y2 is Y0 + Dy/3,
   X3 is X0 + Dx/2 - Dy * Sqrt3_2/3,
   Y3 is Y0 + Dy/2 + Dx * Sqrt3_2/3,
   X4 is X0 + 2 * Dx/3,
   Y4 is Y0 + 2 * Dy/3,
   koch_curve(Stream, X0, Y0, X2, Y2, N1),
   koch_curve(Stream, X2, Y2, X3, Y3, N1),
   koch_curve(Stream, X3, Y3, X4, Y4, N1),
   koch_curve(Stream, X4, Y4, X1, Y1, N1).</lang>
- Output:
See: koch_snowflake.svg (offsite SVG image)
Python
Functional
Generates SVG for a Koch snowflake. To view, save as a text file with the extension .svg, and open in a browser.
<lang python>Koch curve
from math import cos, pi, sin from operator import add, sub from itertools import chain
- kochSnowflake :: Int -> (Float, Float) -> (Float, Float) -> [(Float, Float)]
def kochSnowflake(n, a, b):
   List of points on a Koch snowflake of order n, derived
      from an equilateral triangle with base a b.

   points = [a, equilateralApex(a, b), b]
   return chain.from_iterable(map(
       kochCurve(n),
       points,
       points[1:] + [points[0]]
   ))
- kochCurve :: Int -> (Float, Float) -> (Float, Float)
- -> [(Float, Float)]
def kochCurve(n):
   List of points on a Koch curve of order n,
      starting at point ab, and ending at point xy.

   def koch(n):
       def goTuple(abxy):
           ab, xy = abxy
           if 0 == n:
               return [xy]
           else:
               mp, mq = midThirdOfLine(ab, xy)
               points = [
                   ab,
                   mp,
                   equilateralApex(mp, mq),
                   mq,
                   xy
               ]
               return list(
                   chain.from_iterable(map(
                       koch(n - 1),
                       zip(points, points[1:])
                   ))
               )
       return goTuple
   def go(ab, xy):
       return [ab] + koch(n)((ab, xy))
   return go
- equilateralApex :: (Float, Float) -> (Float, Float) -> (Float, Float)
def equilateralApex(p, q):
   Apex of triangle with base p q.

   return rotatedPoint(pi / 3)(p, q)
- rotatedPoint :: Float -> (Float, Float) ->
- (Float, Float) -> (Float, Float)
def rotatedPoint(theta):
   The point ab rotated theta radians
       around the origin xy.

   def go(xy, ab):
       ox, oy = xy
       a, b = ab
       dx, dy = rotatedVector(theta, (a - ox, oy - b))
       return ox + dx, oy - dy
   return go
- rotatedVector :: Float -> (Float, Float) -> (Float, Float)
def rotatedVector(theta, xy):
   The vector xy rotated by theta radians.

   x, y = xy
   return (
       x * cos(theta) - y * sin(theta),
       x * sin(theta) + y * cos(theta)
   )
- midThirdOfLine :: (Float, Float) -> (Float, Float)
- -> ((Float, Float), (Float, Float))
def midThirdOfLine(ab, xy):
   Second of three equal segments of
      the line between ab and xy.

   vector = [x / 3 for x in map(sub, xy, ab)]
   def f(p):
       return tuple(map(add, vector, p))
   p = f(ab)
   return (p, f(p))
- -------------------------- TEST --------------------------
- main :: IO ()
def main():
   SVG for Koch snowflake of order 4.

   print(
       svgFromPoints(1024)(
           kochSnowflake(
               4, (200, 600), (800, 600)
           )
       )
   )
- -------------------------- SVG ---------------------------
- svgFromPoints :: Int -> [(Float, Float)] -> SVG String
def svgFromPoints(w):
   Width of square canvas -> Point list -> SVG string.

   def go(xys):
       xs = ' '.join(map(
           lambda xy: str(round(xy[0], 2)) + ' ' + str(round(xy[1], 2)),
           xys
       ))
       return '\n'.join([
           '<svg xmlns="http://www.w3.org/2000/svg"',
           f'width="512" height="512" viewBox="5 5 {w} {w}">',
           f'<path d="M{xs}" ',
           'stroke-width="2" stroke="red" fill="transparent"/>',
           '</svg>'
       ])
   return go
- MAIN ---
if __name__ == '__main__':
main()</lang>
String rewriting
<lang python>import numpy as np import matplotlib.pyplot as plt from matplotlib.colors import hsv_to_rgb as hsv
def curve(axiom, rules, angle, depth):
   for _ in range(depth):
       axiom = .join(rules[c] if c in rules else c for c in axiom)
   a, x, y = 0, [0], [0]
   for c in axiom:
       match c:
           case '+':
               a += 1
           case '-':
               a -= 1
           case 'F' | 'G':
               x.append(x[-1] + np.cos(a*angle*np.pi/180))
               y.append(y[-1] + np.sin(a*angle*np.pi/180))
   l = len(x)
   # this is very slow, but pretty colors
   for i in range(l - 1):
       plt.plot(x[i:i+2], y[i:i+2], color=hsv([i/l, 1, .7]))
   plt.gca().set_aspect(1)
   plt.show()
curve('F++F++F', {'F': 'F+F--F+F'}, 60, 5)
- curve('F--XF--F--XF', {'X': 'XF+G+XF--F--XF+G+X'}, 45, 5)
- curve('F+XF+F+XF', {'X': 'XF-F+F-XF+F+XF-F+F-X'}, 90, 5)
- curve('F', {'F': 'G-F-G', 'G': 'F+G+F'}, 60, 7)
- curve('A', {'A': '+BF-AFA-FB+', 'B': '-AF+BFB+FA-'}, 90, 6)
- curve('FX+FX+', {'X': 'X+YF', 'Y': 'FX-Y'}, 90, 12)</lang>
QBasic
<lang qbasic> ' Chaos: start at any point, this program uses the middle of the screen (or universe. One of six
   ' degrees of freedom (a direction)  is chosen at random  (by throwing a six-sided die),  and a line
   ' is drawn from the old point to the new point in the direction indicated by the pip on the die.
   '
   ' The traverse distance is always a fraction of the last distance drawn;  the fraction (here) uses:
   '
   '                                       +-                                -+
   '                                       |                                  |
   '       distance  <===  old_distance *  |  1/2 - 1/8 - 1/32 - 1/128 - ...  |
   '                                       |                                  |
   '                                       +-                                -+
   '            ---or---
   '                                       +-                                -+
   '                                       |   1     1     1      1           |
   '       distance  <===  old_distance *  |  --- - --- - ---- - ----- - ...  |
   '                                       |  2**1  2**3  2**5   2**7         |
   '                                       +-                                -+
   '
   ' (The series above has a limit of  1/3.)
   '
   ' The six degrees of freedom:                      1         6
   '
   '                                                    \     /
   '                                                     \   /
   '                                                      \ /
   '                                            2  <------ X ------>  5
   '                                                      / \
   '                                                     /   \
   '                                                    /     \
   '
   '                                                  3         4
   '
   ' When the amount to be moved is too small to show on the terminal screen,  the chaos curve is
   ' starting again  (from the initial point,  the middle of the screen/universe).
   '
   ' All subsequent chaos curves are superimposed on the first curve.
   '
   ' The envelope of this chaos curve is defined as the snowflake curve.
   '
   ' If any cursor key (one of the "arrow" keys) is pressed,  program execution is halted.
   '
   ' If any function key is pressed during execution, the random chaos curve is stopped, the screen
   ' cleared, and the snowflake curve is drawn by a non-random method (brute force).
   '
   ' Once the random snowflake (chaos) curve is being drawn, the pressing of function keys 1-->9 will
   ' force the randomness to move in a particular direction, the direction (the degree of freedom) is
   ' the direction indicated by the number of times that function key is pressed for that curve point.
   ' That is, function key 1 is used for the first point (part of the chaos curve),  function key 2 is
   ' used for the second point, function key 3 for the third point,  etc.
   DEFINT A-Y                    ' define variables that begin with   A-->Y   as integers.
   DEFSNG Z                      ' define variables that begin with     Z     as single precision.
   DIM XP(16,6),YP(16,6),KY(16)  ' define some (integer) arrays.
   MP= 16                        ' set the maximum number of points (1st dimension) that can be plotted.
   CLS                           ' clear the screen for visual fidelity.
   SCREEN 2                      ' make the screen high-res graphics.
   GOTO 230                      ' branch around a  RETURN  statement that  ON KEY(i) uses.
220 RETURN 230 FK= 0 ' set FK (used to indicate that a function key was pressed).
     FOR I=1  TO 10              ' allow the use of function keys to stop the deliberate snowflake
                                 ' curve and start drawing it randomly.
     KY(I)= 0
     ON KEY(I)  GOSUB 220        ' allow the trapping of function keys,  but don't process it as yet.
     KEY(I)  ON
     KEY(I) STOP
     NEXT I
   CLS                           ' clear the screen for visual fidelity.
   ZZ= 2 + TIMER                 ' on some PCs, a pause of at least one second prevents scrolling.
240 IF TIMER<ZZ THEN GOTO 240
   RANDOMIZE TIMER               ' randomize the RND function from the timer.
   XM= 640 - 1                   ' define the number of points on the screen (for plotting).
   YM= 200 - 1
   XO= XM \ 2                    ' define the origin of the chaos curve.
   YO= YM \ 2
   ZT= 1 / 3                     ' define the traverse distance,  it's this distance that each part of
                                 ' the chaos curve "breaks",  when the distance that the next part of
                                 ' the chaos curve is moved to.
   ZA= 1                         ' define the aspect ratio for the terminal screen.
   ZX= XM * ZA                   ' define the initial distance to be plotted (for a line).
   ZY= YM                        '    "    "     "        "     "  "    "      "  "   "
          FOR I=1  TO MP         ' compute (once) all the  x & y  distances for each part of the curve.
          ZX= ZX * ZT * ZA
          ZY= ZY * ZT
          XP(I, 1) = -ZX / 2
          XP(I, 2) = -ZX
          XP(I, 3) = -ZX / 2
          XP(I, 4) =  ZX / 2
          XP(I, 5) =  ZX
          XP(I, 6) =  ZX / 2
          YP(I, 1) = -ZY
          YP(I, 2) =   0
          YP(I, 3) =  ZY
          YP(I, 4) =  ZY
          YP(I, 5) =   0
          YP(I, 6) = -ZY
          NEXT I
   N0=0
          FOR II=1  TO MP        ' find the maximum number of points that can be plotted.
            FOR I=1  TO 6
            IF XP(II, I) <> 0  THEN N0= II
            IF YP(II, I) <> 0  THEN N0= II
            NEXT I
          NEXT II
          FOR I=11  TO 14        ' quit if any cursor key is pressed.
          ON KEY(I)  GOSUB 598
          KEY(I)  ON
          NEXT I
          FOR I=1  TO 10         ' If any function key is pressed during execution, the deliberate
          ON KEY(I)  GOSUB 400   ' curve is stopped,  the screen is cleared, and the snowflake curve is
          KEY(I)  ON             ' drawn by a random process  (AKA,  the chaos curve).
          NEXT I
GOTO 500
400 FK= 1 ' come here when any function or cursor key is pressed, and set FK
                                 ' that is checked by the deliberate snowflake curve generator.
   RETURN
500 CLS ' clear the screen before starting (for visual fidelity).
                 FOR I1=1  TO 6  ' plot the curve via non-random (deliberate calculation) points.
                 X1= XO  +  XP(1, I1)
                 Y1= YO  +  YP(1, I1)
                 IF FK  THEN GOTO 600
                 LINE (XO, YO)  -  (X1, Y1)
                   FOR I2=1  TO 6
                   X2= X1  +  XP(2,I2)
                   Y2= Y1  +  YP(2,I2)
                   IF FK  THEN GOTO 600
                   LINE (X1, Y1)  -  (X2, Y2)
                     FOR I3=1  TO 6
                     X3= X2  +  XP(3, I3)
                     Y3= Y2  +  YP(3, I3)
                     IF FK  THEN GOTO 600
                     LINE (X2, Y2)  -  (X3, Y3)
                       FOR I4=1  TO 6
                       X4= X3  +  XP(4, I4)
                       Y4= Y3  +  YP(4, I4)
                       IF FK  THEN GOTO 600
                       LINE (X3, Y3)  -  (X4, Y4)
                         FOR I5=1  TO 6
                         X5= X4  +  XP(5, I5)
                         Y5= Y4  +  YP(5, I5)
                         IF FK  THEN GOTO 600
                         LINE (X4, Y4)  -  (X5, Y5)
                         NEXT I5
                       NEXT I4
                     NEXT I3
                   NEXT I2
                 NEXT I1
   ZZ= 10+TIMER                  ' The snowflake curve is now complete.
555 IF TIMER<ZZ THEN GOTO 555 ' loop for ten seconds. 598 SYSTEM ' stick a fork in it, we're all done.
600 ON KEY(1) GOSUB 710 ' trap all function keys for toggling.
   ON  KEY(2)   GOSUB 720
   ON  KEY(3)   GOSUB 730
   ON  KEY(4)   GOSUB 740
   ON  KEY(5)   GOSUB 750
   ON  KEY(6)   GOSUB 760
   ON  KEY(7)   GOSUB 770
   ON  KEY(8)   GOSUB 780
   ON  KEY(9)   GOSUB 790
   ON  KEY(10)  GOSUB 700
             FOR I=1  TO MP      ' re-active trapping all the function keys.
             KEY(I)  ON
             NEXT I
   CLS                           ' clear the screen before starting.
   GOTO 900                      ' go and start drawing the chaos curve.
700 FOR I0=1 TO MP ' reset all toggle settings for all points.
             KY(I0)= 0
             NEXT I0
   RETURN
710 KI= 1 ' toggle setting for point #1 (bypass).
GOTO 800
720 KI= 2 ' toggle setting for point #2 (bypass).
GOTO 800
730 KI= 3 ' toggle setting for point #3 (bypass).
GOTO 800
740 KI= 4 ' toggle setting for point #4 (bypass).
GOTO 800
750 KI= 5 ' toggle setting for point #5 (bypass).
GOTO 800
760 KI= 6 ' toggle setting for point #6 (bypass).
GOTO 800
770 KI= 7 ' toggle setting for point #7 (bypass).
GOTO 800
780 KI= 8 ' toggle setting for point #8 (bypass).
GOTO 800
790 KI= 9 ' toggle setting for point #9 (bypass).
800 KY(KI)= (1 + KY(KI) ) MOD 7 ' reset toggle settings for all higher points.
             FOR IK=KI+1  TO MP
             KY(IK)= 0
             NEXT IK
   RETURN
900 N= 0 ' initialize the number of points in this particular chaos curve.
   X= XO                         ' move the start-of-the-chaos-curve to the origin.
   Y= YO
   LINE (X, Y)  -  (X, Y)
   N= N + 1                      ' bump number of points drawn so far.
   IF N>N0   THEN GOTO 900       ' # points drawn exceeds possible?  Start another chaos curve.
                                 ' start of diminishing loop to create an envelope for the chaos curve.
   IF KY(N)  THEN R= KY(N)   ELSE R= 1 + INT(RND*6)
   X= X  +  XP(N, R)             ' exercise a degree of freedom (one of six).
   Y= Y  +  YP(N, R)
   LINE -(X, Y)                  ' depending on the "die",  draw the next part of the chaos curve.
                  GOTO 900       ' now, go and do another point.</lang>
Quackery
Using an L-system.
<lang Quackery> [ $ "turtleduck.qky" loadfile ] now!
 [ $ "" swap witheach
     [ nested quackery join ] ]    is expand ( $ --> $ )

 [ $ "FRFLLFRF" ]                  is F      ( $ --> $ )

 [ $ "L" ]                         is L      ( $ --> $ )

 [ $ "R" ]                         is R      ( $ --> $ )

 $ "FLLFLLF"

 4 times expand

 turtle
 witheach
   [ dup char F = iff
       [ drop 3 1 walk ] done
     char L = iff
       [ -1 6 turn ] done
      1 6 turn ]</lang>
- Output:
Racket
<lang racket>#lang racket
(require metapict)
- rot
- rotate d degrees around point p, where c is a point or curve
(def (rot d p c)
(rotated-aboutd d p c))
(define (koch a b n)
 (match n
   [0 (draw (curve a -- b))]
   [_ (def 1/3ab (med 1/3 a b))
      (def 2/3ab (med 2/3 a b))
      (draw (koch a 1/3ab                      (- n 1))
            (koch 1/3ab (rot 60 1/3ab 2/3ab)   (- n 1))
            (koch (rot 60 1/3ab 2/3ab) 2/3ab   (- n 1))
            (koch 2/3ab b                      (- n 1)))]))
(define (snow n)
 (def a (pt 0 0))
 (def b (pt 1 0))
 (def c (rot 60 a b))
 (draw (koch b a n)
       (koch c b n)
       (koch a c n)))
(scale 4 (snow 2))</lang>
Raku
(formerly Perl 6)
Koch curve, actually a full Koch snowflake. <lang perl6>use SVG;
role Lindenmayer {
   has %.rules;
   method succ {
       self.comb.map( { %!rules{$^c} // $c } ).join but Lindenmayer(%!rules)
   }
}
my $flake = 'F--F--F' but Lindenmayer( { F => 'F+F--F+F' } );
$flake++ xx 5; my @points = (50, 440);
for $flake.comb -> $v {
   state ($x, $y) = @points[0,1];
   state $d = 2 + 0i;
   with $v {
       when 'F' { @points.append: ($x += $d.re).round(.01), ($y += $d.im).round(.01) }
       when '+' { $d *= .5 + .8660254i }
       when '-' { $d *= .5 - .8660254i }
   }
}
say SVG.serialize(
   svg => [
       width => 600, height => 600, style => 'stroke:rgb(0,0,255)',
       :rect[:width<100%>, :height<100%>, :fill<white>],
       :polyline[ points => @points.join(','), :fill<white> ],
   ],
);</lang>
See: Koch snowflake
Variation using 90° angles: <lang perl6>use SVG;
role Lindenmayer {
   has %.rules;
   method succ {
self.comb.map( { %!rules{$^c} // $c } ).join but Lindenmayer(%!rules)
}
}
my $koch = 'F' but Lindenmayer( { F => 'F+F-F-F+F', } );
$koch++ xx 4; my @points = (450, 250);
for $koch.comb -> $v {
   state ($x, $y) = @points[0,1];
   state $d = -5 - 0i;
   with $v {
       when 'F' { @points.append: ($x += $d.re).round(.01), ($y += $d.im).round(.01) }
       when /< + - >/ { $d *= "{$v}1i" }
   }
}
say SVG.serialize(
   svg => [
       width => 500, height => 300, style => 'stroke:rgb(0,0,255)',
       :rect[:width<100%>, :height<100%>, :fill<white>],
       :polyline[ points => @points.join(','), :fill<white> ],
   ],
);</lang> See: Koch curve variant with 90° angles
Ring
<lang ring>
- Project : Koch curve
load "guilib.ring"
paint = null
new qapp
       {
       win1 = new qwidget() {
                 setwindowtitle("Koch curve")
                 setgeometry(100,100,500,600)
                 label1 = new qlabel(win1) {
                             setgeometry(10,10,400,400)
                             settext("")
                 }
                 new qpushbutton(win1) {
                         setgeometry(150,500,100,30)
                         settext("draw")
                         setclickevent("draw()")
                 }
                 show()
       }
       exec()
       }
func draw
       p1 = new qpicture()
              color = new qcolor() {
              setrgb(0,0,255,255)
       }
       pen = new qpen() {
                setcolor(color)
                setwidth(1)
       }
       paint = new qpainter() {
                 begin(p1)
                 setpen(pen)
koch(100, 100, 400, 400, 4)
       endpaint()
       }
       label1 { setpicture(p1) show() }
func koch x1, y1, x2, y2, it
       angle = 60*3.14/180
       x3 = (2*x1+x2)/3
       y3 = (2*y1+y2)/3
       x4 = (x1+2*x2)/3
       y4 = (y1+2*y2)/3
       x = x3 + (x4-x3)*cos(angle)+(y4-y3)*sin(angle)
       y = y3 - (x4-x3)*sin(angle)+(y4-y3)*cos(angle)
      if (it > 0)
         koch(x1, y1, x3, y3, it-1)
         koch(x3, y3, x, y, it-1)
         koch(x, y, x4, y4, it-1)
         koch(x4, y4, x2, y2, it-1)
      else
         paint.drawline(x1, y1, x3, y3)
         paint.drawline(x3, y3, x, y)
         paint.drawline(x, y, x4, y4)
         paint.drawline(x4, y4, x2, y2)
     ok
</lang> Output image:
Ruby
Using a Lindenmayer System to produce a KochSnowflake or simple Koch Fractal <lang ruby> attr_reader :koch def settings
size 600, 600
end
def setup
 sketch_title '2D Koch'
 @koch = KochSnowflake.new
 koch.create_grammar 5
 no_loop
end
def draw
 background 0
 koch.render
end
- LSystem class
class Grammar
 attr_reader :axiom, :rules
 def initialize(axiom, rules)
   @axiom = axiom
   @rules = rules
 end
 def apply_rules(prod)
   prod.gsub(/./) { |token| rules.fetch(token, token) }
 end
 def generate(gen)
   return axiom if gen.zero?
   prod = axiom
   gen.times do
     prod = apply_rules(prod)
   end
   prod
 end
end
Turtle = Struct.new(:x, :y, :theta)
- KochSnowflake class has access to Sketch methods eg :line, :width, :height
class KochSnowflake
include Processing::Proxy
 attr_reader :grammar, :axiom, :draw_length, :production, :turtle
 DELTA = 60.radians
 def initialize
   @axiom = 'F--F--F' # 'F' for simple Koch Curve
   @grammar = Grammar.new(
     axiom,
     'F' => 'F+F--F+F'
   )
   @draw_length = 20
   stroke 0, 255, 0
   stroke_weight 2
   @turtle = Turtle.new(width / 5, height * 0.7, 0)
 end
 def render
   production.scan(/./) do |element|
     case element
     when 'F' # NB NOT using affine transforms
       draw_line(turtle)
     when '+'
       turtle.theta += DELTA
     when '-'
       turtle.theta -= DELTA
     when 'L', 'R'
     else puts 'Grammar not recognized'
     end
   end
 end
 def draw_line(turtle)
   x_temp = turtle.x
   y_temp = turtle.y
   @turtle.x += draw_length * Math.cos(turtle.theta)
   @turtle.y += draw_length * Math.sin(turtle.theta)
   line(x_temp, y_temp, turtle.x, turtle.y)
 end
 ##############################
 # create grammar from axiom and
 # rules (adjust scale)
 ##############################
 def create_grammar(gen)
   @draw_length *= 0.6**gen
   @production = @grammar.generate gen
 end
end
</lang>
Rust
Output is a file in SVG format depicting a Koch snowflake. <lang rust>// [dependencies] // svg = "0.8.0"
use svg::node::element::path::Data; use svg::node::element::Path; use svg::node::element::Rectangle;
const SQRT3_2: f64 = 0.86602540378444;
fn koch_curve(mut data: Data, x0: f64, y0: f64, x1: f64, y1: f64, order: usize) -> Data {
   if order == 0 {
       data = data.line_to((x1, y1));
   } else {
       let dx = x1 - x0;
       let dy = y1 - y0;
       let x2 = x0 + dx / 3.0;
       let y2 = y0 + dy / 3.0;
       let x3 = x0 + dx / 2.0 - dy * SQRT3_2 / 3.0;
       let y3 = y0 + dy / 2.0 + dx * SQRT3_2 / 3.0;
       let x4 = x0 + 2.0 * dx / 3.0;
       let y4 = y0 + 2.0 * dy / 3.0;
       data = koch_curve(data, x0, y0, x2, y2, order - 1);
       data = koch_curve(data, x2, y2, x3, y3, order - 1);
       data = koch_curve(data, x3, y3, x4, y4, order - 1);
       data = koch_curve(data, x4, y4, x1, y1, order - 1);
   }
   data
}
fn write_koch_snowflake(file: &str, size: usize, order: usize) -> std::io::Result<()> {
   let length = (size as f64) * SQRT3_2 * 0.95;
   let x0 = ((size as f64) - length) / 2.0;
   let y0 = (size as f64) / 2.0 - length * SQRT3_2 / 3.0;
   let x1 = x0 + length / 2.0;
   let y1 = y0 + length * SQRT3_2;
   let x2 = x0 + length;
   let mut data = Data::new().move_to((x0, y0));
   data = koch_curve(data, x0, y0, x1, y1, order);
   data = koch_curve(data, x1, y1, x2, y0, order);
   data = koch_curve(data, x2, y0, x0, y0, order);
   let path = Path::new()
       .set("fill", "none")
       .set("stroke", "white")
       .set("stroke-width", "1")
       .set("d", data);
   let rect = Rectangle::new()
       .set("width", "100%")
       .set("height", "100%")
       .set("fill", "black");
   let document = svg::Document::new()
       .set("width", size)
       .set("height", size)
       .add(rect)
       .add(path);
svg::save(file, &document)
}
fn main() {
write_koch_snowflake("koch_snowflake.svg", 600, 5).unwrap();
}</lang>
- Output:
See: koch_snowflake.svg (offsite SVG image)
Sidef
Using the LSystem class defined at Hilbert curve. <lang ruby>var rules = Hash(
F => 'F+F--F+F',
)
var lsys = LSystem(
   width:  800,
   height: 800,
   xoff: -210,
   yoff: -90,
   len:   8,
   angle: 60,
   color: 'dark green',
)
lsys.execute('F--F--F', 4, "koch_snowflake.png", rules)</lang>
Output image: Koch snowflake
VBScript
VBScript does'nt have access to the OS graphics, so the code generates SVG code in an HTML file then opens it in the default browser A Turtle graphics library makes defining the curve easy.
<lang vb>
option explicit 'outputs turtle graphics to svg file and opens it
const pi180= 0.01745329251994329576923690768489 ' pi/180 const pi=3.1415926535897932384626433832795 'pi class turtle
  dim fso
  dim fn
  dim svg

  dim iang  'radians
  dim ori   'radians
  dim incr
  dim pdown
  dim clr
  dim x
  dim y
  public property let orient(n):ori = n*pi180 :end property
  public property let iangle(n):iang= n*pi180 :end property
  public sub pd() : pdown=true: end sub
  public sub pu()  :pdown=FALSE :end sub

  public sub rt(i)
    ori=ori - i*iang:
    if ori<0 then ori = ori+pi*2
  end sub
  public sub lt(i):
    ori=(ori + i*iang)
    if ori>(pi*2) then ori=ori-pi*2
  end sub

  public sub bw(l)
     x= x+ cos(ori+pi)*l*incr
     y= y+ sin(ori+pi)*l*incr
  end sub

  public sub fw(l)
     dim x1,y1
     x1=x + cos(ori)*l*incr
     y1=y + sin(ori)*l*incr
     if pdown then line x,y,x1,y1
     x=x1:y=y1
  end sub

  Private Sub Class_Initialize()
     initsvg
     pdown=true
  end sub

  Private Sub Class_Terminate()
     disply
  end sub

  private sub line (x,y,x1,y1)
     svg.WriteLine "<line x1=""" & x & """ y1= """& y & """ x2=""" & x1& """ y2=""" & y1 & """/>"
  end sub
  private sub disply()
      dim shell
      svg.WriteLine "</svg></body></html>"
      svg.close
      Set shell = CreateObject("Shell.Application")
      shell.ShellExecute fn,1,False
  end sub
  private sub initsvg()
    dim scriptpath
    Set fso = CreateObject ("Scripting.Filesystemobject")
    ScriptPath= Left(WScript.ScriptFullName, InStrRev(WScript.ScriptFullName, "\"))
    fn=Scriptpath & "SIERP.HTML"
    Set svg = fso.CreateTextFile(fn,True)
    if SVG IS nothing then wscript.echo "Can't create svg file" :vscript.quit
    svg.WriteLine "<!DOCTYPE html>" &vbcrlf & "<html>" &vbcrlf & "<head>"
    svg.writeline "<style>" & vbcrlf & "line {stroke:rgb(255,0,0);stroke-width:.5}" &vbcrlf &"</style>"
    svg.writeline "</head>"&vbcrlf & "<body>"
    svg.WriteLine "<svg xmlns=""http://www.w3.org/2000/svg"" width=""800"" height=""800"" viewBox=""0 0 800 800"">"
  end sub
end class
sub koch (n,le)
 if n=0 then x.fw le :exit sub
 koch n-1, le/3
 x.lt 1
 koch n-1, le/3
 x.rt 2
 koch n-1, le/3
 x.lt 1
 koch n-1, le/3
end sub
dim x,i
set x=new turtle x.iangle=60 x.orient=0 x.incr=3 x.x=100:x.y=300 for i=0 to 3
 koch 7,100
 x.rt 2
next set x=nothing 'show image in browser
</lang>
Wren
<lang ecmascript>import "graphics" for Canvas, Color, Point import "dome" for Window import "math" for M
class Game {
   static init() {
       Window.title = "Koch curve"
       Canvas.resize(512, 512)
       Window.resize(512, 512)
       Canvas.cls(Color.white) // white background
       koch(100, 100, 400, 400, 4)
       koch(101, 100, 401, 400, 4) // 2 pixels wide
   }
   static koch(x1, y1, x2, y2, iter) {
       var angle = Num.pi / 3 // 60 degrees
       var x3 = (x1*2 + x2) / 3
       var y3 = (y1*2 + y2) / 3
       var x4 = (x1 + x2*2) / 3
       var y4 = (y1 + y2*2) / 3
       var x5 = x3 + (x4-x3)*M.cos(angle) + (y4-y3)*M.sin(angle)
       var y5 = y3 - (x4-x3)*M.sin(angle) + (y4-y3)*M.cos(angle)
       if (iter > 0) {
           iter = iter - 1
           koch(x1, y1, x3, y3, iter)
           koch(x3, y3, x5, y5, iter)
           koch(x5, y5, x4, y4, iter)
           koch(x4, y4, x2, y2, iter)
       } else {
           Canvas.line(x1, y1, x3, y3, Color.blue)
           Canvas.line(x3, y3, x5, y5, Color.blue)
           Canvas.line(x5, y5, x4, y4, Color.blue)
           Canvas.line(x4, y4, x2, y2, Color.blue)
       }
   }
static update() {}
static draw(dt) {}
}</lang>
XPL0
<lang XPL0>real PosX, PosY, Angle;
proc DrawSide(Depth, Dist); \Draw side as 4 segments int Depth; real Dist; int I; real Dir; def Deg2Rad = 3.14159265358979323846/180.; [Dir:= [0., -60., 120., -60.]; for I:= 0 to 3 do
   [Angle:= Angle + Dir(I);
   if Depth < 4 then DrawSide(Depth+1, Dist/3.)
   else [PosX:= PosX + Dist*Cos(Angle*Deg2Rad);
         PosY:= PosY + Dist*Sin(Angle*Deg2Rad);
         Line(fix(PosX), fix(PosY), $F \BrWhite\);
        ];
   ];
];
int Side; [SetVid($107); \set 1280x1024x8 VESA graphic display PosX:= float(1280/2); PosY:= 0.; Move(fix(PosX), fix(PosY)); \set start of Line Angle:= 60.; \heading = 60 degrees for Side:= 1 to 3 do \sides of triangle
   [DrawSide(0, 290.);
   Angle:= Angle + 120.;
   ];
]</lang>
- Output:
Essentially the same as the C++ image.
zkl
Uses Image Magick and the PPM class from http://rosettacode.org/wiki/Bitmap/Bresenham%27s_line_algorithm#zkl <lang zkl>var width=512, height=512, img=PPM(width,height,0xFfffFF); // white canvas var angle=(60.0).toRad(); const green=0x00FF00;
fcn koch(x1,y1, x2,y2, it){
  x3,y3 := (x1*2 + x2)  /3, (y1*2 + y2)  /3;
  x4,y4 := (x1   + x2*2)/3, (y1   + y2*2)/3;
  x:=x3 + (x4-x3)*angle.cos() + (y4-y3)*angle.sin();
  y:=y3 - (x4-x3)*angle.sin() + (y4-y3)*angle.cos();

  if(it>0){
     it-=1;
     koch(x1,y1, x3,y3, it);
     koch(x3,y3, x, y,  it);
     koch(x, y,  x4,y4, it);
     koch(x4,y4, x2,y2, it);
  }else{
     x,y, x1,y1, x2,y2, x3,y3, x4,y4 =
        T(x,y, x1,y1, x2,y2, x3,y3, x4,y4).apply("toInt");
     img.line(x1,y1, x3,y3, green);
     img.line(x3,y3, x, y,  green);
     img.line(x, y,  x4,y4, green);
     img.line(x4,y4, x2,y2, green);
  }
}
koch(100.0,100.0, 400.0,400.0, 4); img.writeJPGFile("koch.zkl.jpg");</lang> Image at koch curve
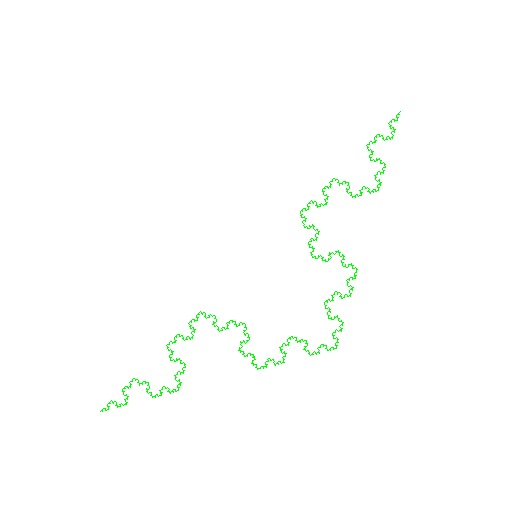
Using a Lindenmayer system and turtle graphics to draw a Koch snowflake:
<lang zkl>lsystem("F--F--F", Dictionary("F","F+F--F+F"), "+-", 4) // snowflake //lsystem("F", Dictionary("F","F+F--F+F"), "+-", 3) // curve
- turtle(_);
fcn lsystem(axiom,rules,consts,n){ // Lindenmayer system --> string
  foreach k in (consts){ rules.add(k,k) }
  buf1,buf2 := Data(Void,axiom).howza(3), Data().howza(3);  // characters
  do(n){
     buf1.pump(buf2.clear(), rules.get);
     t:=buf1; buf1=buf2; buf2=t;	// swap buffers
  }
  buf1.text		// n=4 snow flake --> 1,792 characters
}
fcn turtle(koch){
  const D=10.0;
  dir,deg60, x,y := 0.0, (60.0).toRad(), 20.0, 710.0; // turtle; x,y are float
  img,color := PPM(850,950), 0x00ff00;
  foreach c in (koch){
     switch(c){
case("F"){ // draw forward dx,dy := D.toRectangular(dir); tx,ty := x,y; x,y = (x+dx),(y+dy); img.line(tx.toInt(),ty.toInt(), x.toInt(),y.toInt(), color); } case("-"){ dir-=deg60 } // turn right 60* case("+"){ dir+=deg60 } // turn left 60*
     }
  }
  img.writeJPGFile("kochSnowFlake.zkl.jpg");
}</lang> Image at Koch snow flake
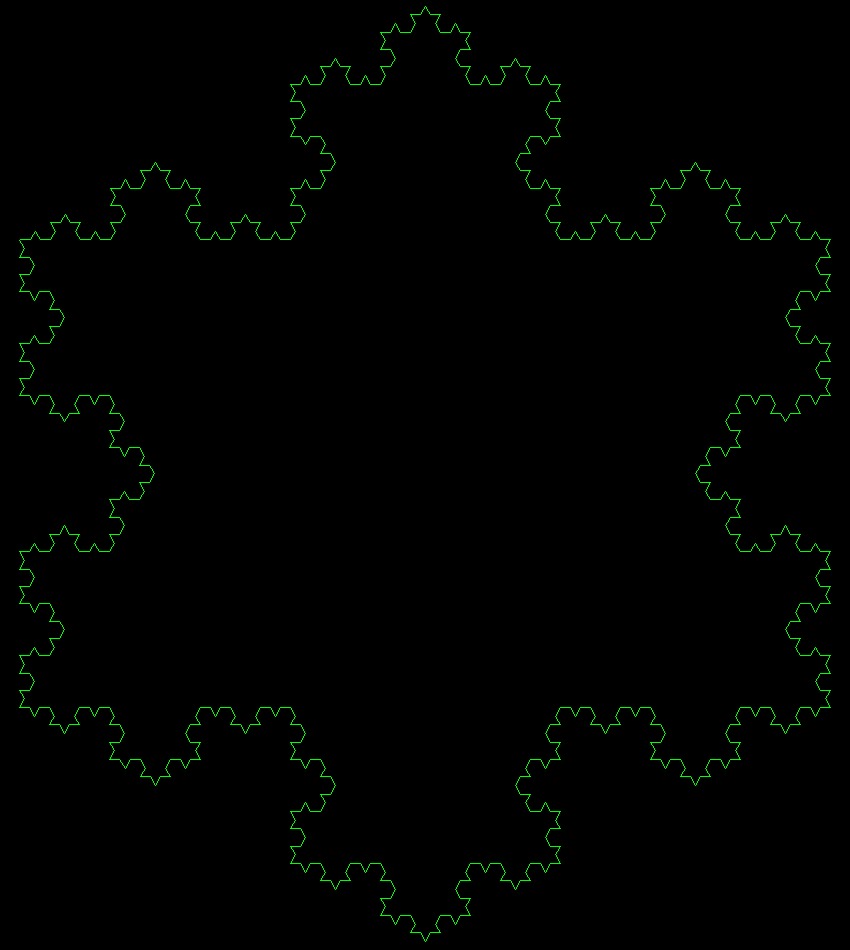