
Peano curve

You are encouraged to solve this task according to the task description, using any language you may know.
- Task
Produce a graphical or ASCII-art representation of a Peano curve of at least order 3.
Action!
Action! language does not support recursion. Therefore an iterative approach with a stack has been proposed.
DEFINE MAXSIZE="12"

INT ARRAY
  angleStack(MAXSIZE)
BYTE ARRAY
  depthStack(MAXSIZE),stageStack(MAXSIZE)
BYTE stacksize=[0]

BYTE FUNC IsEmpty()
  IF stacksize=0 THEN RETURN (1) FI
RETURN (0)

BYTE FUNC IsFull()
  IF stacksize=MAXSIZE THEN RETURN (1) FI
RETURN (0)

PROC Push(INT angle BYTE depth,stage)
  IF IsFull() THEN Break() FI
  angleStack(stacksize)=angle
  depthStack(stacksize)=depth
  stageStack(stackSize)=stage
  stacksize==+1
RETURN

PROC Pop(INT POINTER angle BYTE POINTER depth,stage)
  IF IsEmpty() THEN Break() FI
  stacksize==-1
  angle^=angleStack(stacksize)
  depth^=depthStack(stacksize)
  stage^=stageStack(stacksize)
RETURN

INT FUNC Sin(INT a)
  WHILE a<0 DO a==+360 OD
  WHILE a>360 DO a==-360 OD
  IF a=90 THEN
    RETURN (1)
  ELSEIF a=270 THEN
    RETURN (-1)
  FI
RETURN (0)

INT FUNC Cos(INT a)
RETURN (Sin(a-90))

PROC DrawPeano(INT x BYTE y,len BYTE depth)
  BYTE stage
  INT angle=[90],a

  Plot(x,y)
  Push(90,depth,0)

  WHILE IsEmpty()=0
  DO
    Pop(@a,@depth,@stage)
    IF stage<3 THEN
      Push(a,depth,stage+1)
    FI
    IF stage=0 THEN
      angle==+a
      IF depth>1 THEN
        Push(-a,depth-1,0)
      FI
    ELSEIF stage=1 THEN
      x==+len*Cos(angle)
      y==-len*Sin(angle)
      DrawTo(x,y)
      IF depth>1 THEN
        Push(a,depth-1,0)
      FI
    ELSEIF stage=2 THEN
      x==+len*Cos(angle)
      y==-len*Sin(angle)
      DrawTo(x,y)
      IF depth>1 THEN
        Push(-a,depth-1,0)
      FI
    ELSEIF stage=3 THEN
      angle==-a
    FI
  OD
RETURN

PROC Main()
  BYTE CH=$02FC,COLOR1=$02C5,COLOR2=$02C6

  Graphics(8+16)
  Color=1
  COLOR1=$0C
  COLOR2=$02

  DrawPeano(69,186,7,6)

  DO UNTIL CH#$FF OD
  CH=$FF
RETURN- Output:
Screenshot from Atari 8-bit computer
Ada
with PDF_Out;  use PDF_Out;

procedure Peano_Curve is

   Filename   : constant String     := "peano-curve.pdf";
   Order      : constant Positive   := 4;
   Scale      : constant Real       := 2.1;
   Line_Width : constant Real       := 2.5;
   Corner     : constant Point      := (150.0, 50.0);
   Background : constant Color_Type := (0.827, 0.816, 0.016);
   Frame      : constant Rectangle  := (10.0, 10.0, 820.0, 575.0);
   PDF        : PDF_Out_File;

   type Coord is record
      X, Y : Natural;
   end record;

   function "+" (Left : Coord; Right : Coord) return Coord
   is ((Left.X + Right.X, Left.Y + Right.Y));

   function "*" (Left : Natural; Right : Coord) return Coord
   is ((Left * Right.X, Left * Right.Y));

   procedure Peano (Pos : Coord; Length : Positive; I1, I2 : Integer) is
      Len : constant Integer := Length / 3;
   begin
      if Length = 1 then
         PDF.Line (Corner + Scale * (Real (3 * Pos.X), Real (3 * Pos.Y)));
      else
         Peano (Pos + Len * (2 * I1,      2 * I1),      Len, I1,     I2);
         Peano (Pos + Len * (I1 - I2 + 1, I1 + I2),     Len, I1,     1 - I2);
         Peano (Pos + Len * (1,           1),           Len, I1,     1 - I2);
         Peano (Pos + Len * (I1 + I2,     I1 - I2 + 1), Len, 1 - I1, 1 - I2);
         Peano (Pos + Len * (2 * I2,      2 - 2 * I2),  Len, I1,     I2);
         Peano (Pos + Len * (1 + I2 - I1, 2 - I1 - I2), Len, I1,     I2);
         Peano (Pos + Len * (2 - 2 * I1,  2 - 2 * I1),  Len, I1,     I2);
         Peano (Pos + Len * (2 - I1 - I2, 1 + I2 - I1), Len, 1 - I1, I2);
         Peano (Pos + Len * (2 - 2 * I2,  2 * I2),      Len, 1 - I1, I2);
      end if;
   end Peano;

   procedure Draw_Peano is
   begin
      PDF.Stroking_Color (Black);
      PDF.Line_Width (Line_Width);
      PDF.Move (Corner);
      Peano ((0, 0), 3**Order, 0, 0);
      PDF.Finish_Path (Close_Path => False,
                       Rendering  => Stroke,
                       Rule       => Nonzero_Winding_Number);
   end Draw_Peano;

begin
   PDF.Create (Filename);
   PDF.Page_Setup (A4_Landscape);

   PDF.Color (Background);
   PDF.Draw (Frame, Fill);

   Draw_Peano;
   PDF.Close;
end Peano_Curve;
ALGOL 68
Generates an SVG file containing the curve using the L-System. Very similar to the Algol 68 Sierpinski square curve sample. Note the Algol 68 L-System library source code is on a separate page on Rosetta Code - follow the above link and then to the Talk page.
BEGIN # Peano Curve in SVG                                                   #
      # uses the RC Algol 68 L-System library for the L-System evaluation &  #
      # interpretation                                                       #

    PR read "lsystem.incl.a68" PR               # include L-System utilities #

    PROC peano curve = ( STRING fname, INT size, length, order, init x, init y )VOID:
         IF FILE svg file;
            BOOL open error := IF open( svg file, fname, stand out channel ) = 0
                               THEN
                                   # opened OK - file already exists and     #
                                   #             will be overwritten         #
                                   FALSE
                               ELSE
                                   # failed to open the file                 #
                                   # - try creating a new file               #
                                   establish( svg file, fname, stand out channel ) /= 0
                               FI;
            open error
         THEN                                      # failed to open the file #
            print( ( "Unable to open ", fname, newline ) );
            stop
         ELSE                                               # file opened OK #

            REAL x     := init x;
            REAL y     := init y;
            INT  angle := 90;
            put( svg file, ( "<svg xmlns='http://www.w3.org/2000/svg' width='"
                           , whole( size, 0 ), "' height='", whole( size, 0 ), "'>"
                           , newline, "<rect width='100%' height='100%' fill='white'/>"
                           , newline, "<path stroke-width='1' stroke='black' fill='none' d='"
                           , newline, "M", whole( x, 0 ), ",", whole( y, 0 ), newline
                           )
               );

            LSYSTEM ssc = ( "L"
                          , ( "L" -> "LFRFL-F-RFLFR+F+LFRFL"
                            , "R" -> "RFLFR+F+LFRFL-F-RFLFR"
                            )
                          );
            STRING curve = ssc EVAL order;
            curve INTERPRET ( ( CHAR c )VOID:
                              IF   c = "F" THEN
                                  x +:= length * cos( angle * pi / 180 );
                                  y +:= length * sin( angle * pi / 180 );
                                  put( svg file, ( " L", whole( x, 0 ), ",", whole( y, 0 ), newline ) )
                              ELIF c = "+" THEN
                                  angle +:= 90 MODAB 360
                              ELIF c = "-" THEN
                                  angle -:= 90 MODAB 360
                              FI
                            );

            put( svg file, ( "'/>", newline, "</svg>", newline ) );
            close( svg file )
         FI # sierpinski square # ;

    peano curve( "peano.svg", 1200, 12, 3, 50, 50 )

END
AutoHotkey
Requires Gdip Library
gdip1()
PeanoX := A_ScreenWidth/2 - 100, PeanoY := A_ScreenHeight/2 - 100
Peano(PeanoX, PeanoY, 3**3, 5, 5, Arr:=[])
xmin := xmax := ymin := ymax := 0
for i, point in Arr
{
	xmin := A_Index = 1 ? point.x : xmin < point.x ? xmin : point.x
	xmax := point.x > xmax ? point.x : xmax
	ymin := A_Index = 1 ? point.y : ymin < point.y ? ymin : point.y
	ymax := point.y > ymax ? point.y : ymax
}
for i, point in Arr
	points .= point.x - xmin + PeanoX "," point.y - ymin + PeanoY "|"
points := Trim(points, "|")
Gdip_DrawLines(G, pPen, Points)
UpdateLayeredWindow(hwnd1, hdc, 0, 0, Width, Height)
return
; ---------------------------------------------------------------
Peano(x, y, lg, i1, i2, Arr) {
	if (lg =1 )
	{
		Arr[Arr.count()+1, "x"] := x
		Arr[Arr.count(), "y"] := y
		return
	}
	lg := lg/3
	Peano(x+(2*i1*lg)	, y+(2*i1*lg)		, lg	, i1	, i2	, Arr)
	Peano(x+((i1-i2+1)*lg)	, y+((i1+i2)*lg)	, lg	, i1	, 1-i2	, Arr)
	Peano(x+lg		, y+lg			, lg	, i1	, 1-i2	, Arr)
	Peano(x+((i1+i2)*lg)	, y+((i1-i2+1)*lg)	, lg	, 1-i1	, 1-i2	, Arr)
	Peano(x+(2*i2*lg)	, y+(2*(1-i2)*lg)	, lg	, i1	, i2	, Arr)
	Peano(x+((1+i2-i1)*lg)	, y+((2-i1-i2)*lg)	, lg	, i1	, i2	, Arr)
	Peano(x+(2*(1-i1)*lg)	, y+(2*(1-i1)*lg)	, lg	, i1	, i2	, Arr)
	Peano(x+((2-i1-i2)*lg)	, y+((1+i2-i1)*lg)	, lg	, 1-i1	, i2	, Arr)
	Peano(x+(2*(1-i2)*lg)	, y+(2*i2*lg)		, lg	, 1-i1	, i2	, Arr)
}
; ---------------------------------------------------------------
gdip1(){
	global
	If !pToken := Gdip_Startup()
	{
		MsgBox, 48, gdiplus error!, Gdiplus failed to start. Please ensure you have gdiplus on your system
		ExitApp
	}
	OnExit, Exit
	Width := A_ScreenWidth, Height := A_ScreenHeight
	Gui, 1: -Caption +E0x80000 +LastFound +OwnDialogs +Owner +AlwaysOnTop
	Gui, 1: Show, NA
	hwnd1 := WinExist()
	hbm := CreateDIBSection(Width, Height)
	hdc := CreateCompatibleDC()
	obm := SelectObject(hdc, hbm)
	G := Gdip_GraphicsFromHDC(hdc)
	Gdip_SetSmoothingMode(G, 4)
	pPen := Gdip_CreatePen(0xFFFF0000, 2)
}
; ---------------------------------------------------------------
gdip2(){
	global
	Gdip_DeleteBrush(pBrush)
	Gdip_DeletePen(pPen)
	SelectObject(hdc, obm)
	DeleteObject(hbm)
	DeleteDC(hdc)
	Gdip_DeleteGraphics(G)
}
; ---------------------------------------------------------------
Exit:
gdip2()
Gdip_Shutdown(pToken)
ExitApp
Return
C
Adaptation of the C program in the Breinholt-Schierz paper , requires the WinBGIm library.
/*Abhishek Ghosh, 14th September 2018*/

#include <graphics.h>
#include <math.h>

void Peano(int x, int y, int lg, int i1, int i2) {

	if (lg == 1) {
		lineto(3*x,3*y);
		return;
	}

	lg = lg/3;
	Peano(x+(2*i1*lg), y+(2*i1*lg), lg, i1, i2);
	Peano(x+((i1-i2+1)*lg), y+((i1+i2)*lg), lg, i1, 1-i2);
	Peano(x+lg, y+lg, lg, i1, 1-i2);
	Peano(x+((i1+i2)*lg), y+((i1-i2+1)*lg), lg, 1-i1, 1-i2);
	Peano(x+(2*i2*lg), y+(2*(1-i2)*lg), lg, i1, i2);
	Peano(x+((1+i2-i1)*lg), y+((2-i1-i2)*lg), lg, i1, i2);
	Peano(x+(2*(1-i1)*lg), y+(2*(1-i1)*lg), lg, i1, i2);
	Peano(x+((2-i1-i2)*lg), y+((1+i2-i1)*lg), lg, 1-i1, i2);
	Peano(x+(2*(1-i2)*lg), y+(2*i2*lg), lg, 1-i1, i2);
}

int main(void) {

	initwindow(1000,1000,"Peano, Peano");

	Peano(0, 0, 1000, 0, 0); /* Start Peano recursion. */

	getch();
	cleardevice();

	return 0;
}
C++
#include <cmath>
#include <fstream>
#include <iostream>
#include <string>

class peano_curve {
public:
    void write(std::ostream& out, int size, int length, int order);
private:
    static std::string rewrite(const std::string& s);
    void line(std::ostream& out);
    void execute(std::ostream& out, const std::string& s);
    double x_;
    double y_;
    int angle_;
    int length_;
};

void peano_curve::write(std::ostream& out, int size, int length, int order) {
    length_ = length;
    x_ = length;
    y_ = length;
    angle_ = 90;
    out << "<svg xmlns='http://www.w3.org/2000/svg' width='"
        << size << "' height='" << size << "'>\n";
    out << "<rect width='100%' height='100%' fill='white'/>\n";
    out << "<path stroke-width='1' stroke='black' fill='none' d='";
    std::string s = "L";
    for (int i = 0; i < order; ++i)
        s = rewrite(s);
    execute(out, s);
    out << "'/>\n</svg>\n";
}

std::string peano_curve::rewrite(const std::string& s) {
    std::string t;
    for (char c : s) {
        switch (c) {
        case 'L':
            t += "LFRFL-F-RFLFR+F+LFRFL";
            break;
        case 'R':
            t += "RFLFR+F+LFRFL-F-RFLFR";
            break;
        default:
            t += c;
            break;
        }
    }
    return t;
}

void peano_curve::line(std::ostream& out) {
    double theta = (3.14159265359 * angle_)/180.0;
    x_ += length_ * std::cos(theta);
    y_ += length_ * std::sin(theta);
    out << " L" << x_ << ',' << y_;
}

void peano_curve::execute(std::ostream& out, const std::string& s) {
    out << 'M' << x_ << ',' << y_;
    for (char c : s) {
        switch (c) {
        case 'F':
            line(out);
            break;
        case '+':
            angle_ = (angle_ + 90) % 360;
            break;
        case '-':
            angle_ = (angle_ - 90) % 360;
            break;
        }
    }
}

int main() {
    std::ofstream out("peano_curve.svg");
    if (!out) {
        std::cerr << "Cannot open output file\n";
        return 1;
    }
    peano_curve pc;
    pc.write(out, 656, 8, 4);
    return 0;
}
- Output:
EasyLang
proc lsysexp level . axiom$ rules$[] .
   for l to level
      an$ = ""
      for c$ in strchars axiom$
         for i = 1 step 2 to len rules$[]
            if rules$[i] = c$
               c$ = rules$[i + 1]
               break 1
            .
         .
         an$ &= c$
      .
      swap axiom$ an$
   .
.
proc lsysdraw axiom$ x y ang . .
   linewidth 0.3
   move x y
   for c$ in strchars axiom$
      if c$ = "F"
         x += cos dir
         y += sin dir
         line x y
      elif c$ = "-"
         dir -= ang
      elif c$ = "+"
         dir += ang
      .
   .
.
axiom$ = "L"
rules$[] = [ "L" "LFRFL-F-RFLFR+F+LFRFL" "R" "RFLFR+F+LFRFL-F-RFLFR" ]
lsysexp 4 axiom$ rules$[]
lsysdraw axiom$ 5 90 90
Factor
USING: accessors L-system ui ;

: peano ( L-system -- L-system )
    L-parser-dialect >>commands
    [ 90 >>angle ] >>turtle-values
    "L" >>axiom
    {
        { "L" "LFRFL-F-RFLFR+F+LFRFL" }
        { "R" "RFLFR+F+LFRFL-F-RFLFR" }
    } >>rules ;

[ <L-system> peano "Peano curve" open-window ] with-ui

When using the L-system visualizer, the following controls apply:
| Button | Command |
|---|---|
| a | zoom in |
| z | zoom out |
| left arrow | turn left |
| right arrow | turn right |
| up arrow | pitch down |
| down arrow | pitch up |
| q | roll left |
| w | roll right |
| Button | Command |
|---|---|
| x | iterate L-system |
Fōrmulæ
Fōrmulæ programs are not textual, visualization/edition of programs is done showing/manipulating structures but not text. Moreover, there can be multiple visual representations of the same program. Even though it is possible to have textual representation —i.e. XML, JSON— they are intended for storage and transfer purposes more than visualization and edition.
Programs in Fōrmulæ are created/edited online in its website.
In this page you can see and run the program(s) related to this task and their results. You can also change either the programs or the parameters they are called with, for experimentation, but remember that these programs were created with the main purpose of showing a clear solution of the task, and they generally lack any kind of validation.
Solution
Variant 1, by recursion

Test cases


Varian 2, by L-system
There are generic functions written in Fōrmulæ to compute an L-system in the page L-system.
The program that creates a Peano curve is:


FreeBASIC
Const anchura = 243 'una potencia de 3 para una curva uniformemente espaciada

Screenres 700,700

Sub Peano(x As Integer, y As Integer, lg As Integer, i1 As Integer, i2 As Integer)
    If lg = 1 Then
        Line - (x * 3, y * 3)
        Return
    End If
    lg /= 3
    Peano(x + (2 * i1 * lg), y + (2 * i1 * lg), lg, i1, i2)
    Peano(x + ((i1 - i2 + 1) * lg), y + ((i1 + i2) * lg), lg, i1, 1 - i2)
    Peano(x + lg, y + lg, lg, i1, 1 - i2)
    Peano(x + ((i1 + i2) * lg), y + ((i1 - i2 + 1) * lg), lg, 1 - i1, 1 - i2)
    Peano(x + (2 * i2 * lg), y + (2 * (1 - i2) * lg), lg, i1, i2)
    Peano(x + ((1 + i2 - i1) * lg), y + ((2 - i1 - i2) * lg), lg, i1, i2)
    Peano(x + (2 * (1 - i1) * lg), y + (2 * (1 - i1) * lg), lg, i1, i2)
    Peano(x + ((2 - i1 - i2) * lg), y + ((1 + i2 - i1) * lg), lg, 1 - i1, i2)
    Peano(x + (2 * (1 - i2) * lg), y + (2 * i2 * lg), lg, 1 - i1, i2)
End Sub

Peano(0, 0, anchura, 0, 0)

Sleep
FutureBasic
Couldn't help adding a little bling.
_window = 1
_curveSize = 7
_curveOrder = 3 * 3 * 3 * 3 // 3^4

void local fn BuildWindow
  CGRect r = fn CGRectMake( 0, 0, 565, 570 )
  window _window, @"Peano Curve In FutureBasic", r, NSWindowStyleMaskTitled
  WindowSetBackgroundColor( _window, fn ColorBlack )
end fn

local fn Peano( x as long, y as long, lg as long, i1 as long, i2 as long )
  ColorRef color = fn ColorRed

  if ( lg == 1 ) then line to x * _curveSize, y * _curveSize : exit fn
  lg /= 3

  select ( rnd(8) )
    case 1 : color = fn ColorBrown
    case 2 : color = fn ColorRed
    case 3 : color = fn ColorOrange
    case 4 : color = fn ColorYellow
    case 5 : color = fn ColorGreen
    case 6 : color = fn ColorBlue
    case 7 : color = fn ColorPurple
    case 8 : color = fn ColorWhite
  end select

  pen 2, color
  fn Peano( x + 2*i1*     lg,  y + 2*i1*     lg,  lg,  i1,    i2   )
  fn Peano( x + (i1-i2+1)*lg,  y + (i1+i2)*  lg,  lg,  i1,    1-i2 )
  fn Peano( x +           lg,  y +           lg,  lg,  i1,    1-i2 )
  fn Peano( x + (i1+i2)*  lg,  y + (i1-i2+1)*lg,  lg,  1-i1,  1-i2 )
  fn Peano( x + 2*i2*     lg,  y + 2*(1-i2)* lg,  lg,  i1,    i2   )
  fn Peano( x + (1+i2-i1)*lg,  y + (2-i1-i2)*lg,  lg,  i1,    i2   )
  fn Peano( x + 2*(1-i1)* lg,  y + 2*(1-i1)* lg,  lg,  i1,    i2   )
  fn Peano( x + (2-i1-i2)*lg,  y + (1+i2-i1)*lg,  lg,  1-i1,  i2   )
  fn Peano( x + 2*(1-i2)* lg,  y + 2*i2*     lg,  lg,  1-i1,  i2   )
end fn

randomize
fn BuildWindow
fn Peano( 0, 0, _curveOrder, 0, 0 )

HandleEvents- Output:

Go
The following is based on the recursive algorithm and C code in this paper scaled up to 81 x 81 points. The image produced is a variant known as a Peano-Meander curve (see Figure 1(b) here).
package main

import "github.com/fogleman/gg"

var points []gg.Point

const width = 81

func peano(x, y, lg, i1, i2 int) {
    if lg == 1 {
        px := float64(width-x) * 10
        py := float64(width-y) * 10
        points = append(points, gg.Point{px, py})
        return
    }
    lg /= 3
    peano(x+2*i1*lg, y+2*i1*lg, lg, i1, i2)
    peano(x+(i1-i2+1)*lg, y+(i1+i2)*lg, lg, i1, 1-i2)
    peano(x+lg, y+lg, lg, i1, 1-i2)
    peano(x+(i1+i2)*lg, y+(i1-i2+1)*lg, lg, 1-i1, 1-i2)
    peano(x+2*i2*lg, y+2*(1-i2)*lg, lg, i1, i2)
    peano(x+(1+i2-i1)*lg, y+(2-i1-i2)*lg, lg, i1, i2)
    peano(x+2*(1-i1)*lg, y+2*(1-i1)*lg, lg, i1, i2)
    peano(x+(2-i1-i2)*lg, y+(1+i2-i1)*lg, lg, 1-i1, i2)
    peano(x+2*(1-i2)*lg, y+2*i2*lg, lg, 1-i1, i2)
}

func main() {
    peano(0, 0, width, 0, 0)
    dc := gg.NewContext(820, 820)
    dc.SetRGB(1, 1, 1) // White background
    dc.Clear()
    for _, p := range points {
        dc.LineTo(p.X, p.Y)
    }
    dc.SetRGB(1, 0, 1) // Magenta curve
    dc.SetLineWidth(1)
    dc.Stroke()
    dc.SavePNG("peano.png")
}
IS-BASIC
100 PROGRAM "PeanoC.bas"
110 OPTION ANGLE DEGREES
120 SET VIDEO MODE 5:SET VIDEO COLOR 0:SET VIDEO X 40:SET VIDEO Y 27
130 OPEN #101:"video:"
140 DISPLAY #101:AT 1 FROM 1 TO 27
150 PLOT 280,240,ANGLE 90;
160 CALL PEANO(28,90,6)
170 DEF PEANO(D,A,LEV)
180   IF LEV=0 THEN EXIT DEF
190   PLOT RIGHT A;
200   CALL PEANO(D,-A,LEV-1)
210   PLOT FORWARD D;
220   CALL PEANO(D,A,LEV-1)
230   PLOT FORWARD D;
240   CALL PEANO(D,-A,LEV-1)
250   PLOT LEFT A;
260 END DEF
J
This Hilbert variant is taken directly from the j lab "viewmat".
load'viewmat'
hp=: 3 : '(|.,]) 1 (0 _2 _2 ,&.> _2 _1 0 + #y) } (,.|:) y'
HP=: 3 3 $ 0 0 0 0 1
WR=: 16777215 16711680
viewrgb WR {~ hp ^:7 HP
Or, a smaller example (6 iterations instead of 7) and a different color selection:
   require 'viewmat'
   hp=: 3 : '(|.,]) 1 (0 _2 _2 ,&.> _2 _1 0 + #y) } (,.|:) y'
   MG=: 256 #. 128 0 128,:0 192 0
   viewrgb 2 ([ # #"1) MG {~ hp ^:6 [ 0, 0 1 0 ,: 0,
Java
Output is a file in SVG format.
import java.io.*;

public class PeanoCurve {
    public static void main(final String[] args) {
        try (Writer writer = new BufferedWriter(new FileWriter("peano_curve.svg"))) {
            PeanoCurve s = new PeanoCurve(writer);
            final int length = 8;
            s.currentAngle = 90;
            s.currentX = length;
            s.currentY = length;
            s.lineLength = length;
            s.begin(656);
            s.execute(rewrite(4));
            s.end();
        } catch (final Exception ex) {
            ex.printStackTrace();
        }
    }

    private PeanoCurve(final Writer writer) {
        this.writer = writer;
    }

    private void begin(final int size) throws IOException {
        write("<svg xmlns='http://www.w3.org/2000/svg' width='%d' height='%d'>\n", size, size);
        write("<rect width='100%%' height='100%%' fill='white'/>\n");
        write("<path stroke-width='1' stroke='black' fill='none' d='");
    }

    private void end() throws IOException {
        write("'/>\n</svg>\n");
    }

    private void execute(final String s) throws IOException {
        write("M%g,%g\n", currentX, currentY);
        for (int i = 0, n = s.length(); i < n; ++i) {
            switch (s.charAt(i)) {
                case 'F':
                    line(lineLength);
                    break;
                case '+':
                    turn(ANGLE);
                    break;
                case '-':
                    turn(-ANGLE);
                    break;
            }
        }
    }

    private void line(final double length) throws IOException {
        final double theta = (Math.PI * currentAngle) / 180.0;
        currentX += length * Math.cos(theta);
        currentY += length * Math.sin(theta);
        write("L%g,%g\n", currentX, currentY);
    }

    private void turn(final int angle) {
        currentAngle = (currentAngle + angle) % 360;
    }

    private void write(final String format, final Object... args) throws IOException {
        writer.write(String.format(format, args));
    }

    private static String rewrite(final int order) {
        String s = "L";
        for (int i = 0; i < order; ++i) {
            final StringBuilder sb = new StringBuilder();
            for (int j = 0, n = s.length(); j < n; ++j) {
                final char ch = s.charAt(j);
                if (ch == 'L')
                    sb.append("LFRFL-F-RFLFR+F+LFRFL");
                else if (ch == 'R')
                    sb.append("RFLFR+F+LFRFL-F-RFLFR");
                else
                    sb.append(ch);
            }
            s = sb.toString();
        }
        return s;
    }

    private final Writer writer;
    private double lineLength;
    private double currentX;
    private double currentY;
    private int currentAngle;
    private static final int ANGLE = 90;
}
- Output:
jq
Works with gojq, the Go implementation of jq
This entry includes two distinct solutions. In both cases, the jq program generates a SVG document, which can be viewed directly in the browser, at least if the file suffix is ".svg".
Using a Lindenmayer System
In this section, a Lindenmayer system of rules is used with turtle graphics.
The output converted to a .png file can be viewed at https://imgur.com/gallery/4QbUN7I
Simple Turtle Graphics
# => =   0 degrees
# ^  =  90 degrees
# <= = 180 degrees
# v  = 270 degrees

# $start : [$x, $y]
def turtle($start):
  $start
  | if type == "array"  then "M \($start|join(","))" else "M 0,0" end
  | {svg: ., up:true, angle:0};

def turtleUp:   .up=true;
def turtleDown: .up=false;

def turtleRotate($angle): .angle = (360 + (.angle + $angle)) % 360;

def turtleForward($d):
  if .up
  then if   .angle==  0 then .svg += " m \($d),0"
       elif .angle== 90 then .svg += " m 0,-\($d)"
       elif .angle==180 then .svg += " m -\($d),0"
       elif .angle==270 then .svg += " m 0,\($d)"
       else "unsupported angle \(.angle)" | error
       end
  else if   .angle==  0 then .svg += " h \($d)"
       elif .angle== 90 then .svg += " v -\($d)"
       elif .angle==180 then .svg += " h -\($d)"
       elif .angle==270 then .svg += " v \($d)"
       else "unsupported angle \(.angle)" | error
       end
  end;

def svg($size):
  "<svg viewBox=\"0 0 \($size) \($size)\" xmlns=\"http://www.w3.org/2000/svg\">",
  .,
  "</svg>";

def path($fill; $stroke; $width):
  "<path fill=\"\($fill)\" stroke=\"\($stroke)\" stroke-width=\"\($width)\" d=\"\(.svg)\" />";

def draw:
  path("none"; "red"; "0.1") | svg(100) ;
Peano Curve
# Compute the curve using a Lindenmayer system of rules
def rules:
  { L: "LFRFL-F-RFLFR+F+LFRFL",
    R: "RFLFR+F+LFRFL-F-RFLFR" } ;

def peano($count):
  rules as $rules
  | def p($count):
      if $count <= 0 then .
      else gsub("L"; "l") | gsub("R"; $rules["R"]) |  gsub("l"; $rules["L"]) | p($count-1)
      end;
  "L" | p($count) ;

def interpret($x):
  if   $x == "+" then turtleRotate(90)
  elif $x == "-" then turtleRotate(-90)
  elif $x == "F" then turtleForward(1)
  else .
  end;

def peano_curve($n):
  peano($n)
  | split("")
  | reduce .[] as $action (turtle([1,1]) | turtleDown;
      interpret($action) ) ;

peano_curve(4)
| draw- Output:
See https://imgur.com/gallery/4QbUN7I
Peano-Meander curve
Adapted from #Go
A .png version of the SVG image generated using an invocation such as the following can be viewed at https://imgur.com/a/RGQr17J
jq -nr -f peano-curve.jq > peano-curve.svg
# Input: an array
# Output: the array augmented with another x,y pair
def peano($x; $y; $lg; $i1; $i2):
  $lg as $width
  | def p($x; $y; $lg; $i1; $i2):
    if $lg == 1
    then (($width - $x) * 10) as $px
    | (($width - $y) * 10) as $py
    | . + [[$px,$py]]
    else (($lg/3) | floor) as $lg
    | p($x+2*$i1*$lg; $y+2*$i1*$lg; $lg; $i1; $i2)
    | p($x+($i1-$i2+1)*$lg; $y+($i1+$i2)*$lg; $lg; $i1; 1-$i2)
    | p($x+$lg; $y+$lg; $lg; $i1; 1-$i2)
    | p($x+($i1+$i2)*$lg; $y+($i1-$i2+1)*$lg; $lg; 1-$i1; 1-$i2)
    | p($x+2*$i2*$lg; $y+2*(1-$i2)*$lg; $lg; $i1; $i2)
    | p($x+(1+$i2-$i1)*$lg; $y+(2-$i1-$i2)*$lg; $lg; $i1; $i2)
    | p($x+2*(1-$i1)*$lg; $y+2*(1-$i1)*$lg; $lg; $i1; $i2)
    | p($x+(2-$i1-$i2)*$lg; $y+(1+$i2-$i1)*$lg; $lg; 1-$i1; $i2)
    | p($x+2*(1-$i2)*$lg; $y+2*$i2*$lg; $lg; 1-$i1; $i2)
  end;
  p($x; $y; $lg; $i1; $i2);

def svg:
  "<svg viewBox=\"0 0 820 820\" xmlns=\"http://www.w3.org/2000/svg\">" ;

def path($fill; $stroke):
  "<path fill=\"\($fill)\" stroke=\"\($stroke)\" d=\"M ";

def endpath:
  " \" /> </svg>";

def peanoCurve:
  null | peano(0; 0; 81; 0; 0) | map(join(",")) | join(" ");

svg,
( path("none"; "red") + peanoCurve + endpath)- Output:
Julia
The peano function is from the C version.
using Gtk, Graphics, Colors

function peano(ctx, x, y, lg, i1, i2)
    if lg < 3
        line_to(ctx, x - 250, y - 250)
        stroke(ctx)
        move_to(ctx, x - 250 , y - 250)
    else
        lg = div(lg,  3)
        peano(ctx, x + (2 * i1 * lg), y + (2 * i1 * lg), lg, i1, i2)
        peano(ctx, x + ((i1 - i2 + 1) * lg), y + ((i1 + i2) * lg), lg, i1, 1 - i2)
        peano(ctx, x + lg, y + lg, lg, i1, 1 - i2)
        peano(ctx, x + ((i1 + i2) * lg), y + ((i1 - i2 + 1) * lg), lg, 1 - i1, 1 - i2)
        peano(ctx, x + (2 * i2 * lg), y + ( 2 * (1-i2) * lg), lg, i1, i2)
        peano(ctx, x + ((1 + i2 - i1) * lg), y + ((2 - i1 - i2) * lg), lg, i1, i2)
        peano(ctx, x + (2 * (1 - i1) * lg), y + (2 * (1 - i1) * lg), lg, i1, i2)
        peano(ctx, x + ((2 - i1 - i2) * lg), y + ((1 + i2 - i1) * lg), lg, 1 - i1, i2)
        peano(ctx, x + (2 * (1 - i2) * lg), y + (2 * i2 * lg), lg, 1 - i1, i2)
    end
end

const can = @GtkCanvas()
const win = GtkWindow(can, "Peano Curve", 500, 500)

@guarded draw(can) do widget
    ctx = getgc(can)
    h = height(can)
    w = width(can)
    set_source(ctx, colorant"blue")
    set_line_width(ctx, 1)
    peano(ctx, w/2, h/2, 500, 0, 0)
end

show(can)
const cond = Condition()
endit(w) = notify(cond)
signal_connect(endit, win, :destroy)
wait(cond)
Lua
Using the Bitmap class here, with an ASCII pixel representation, then extending..
local PeanoLSystem = {
  axiom = "L",
  rules = {
    L = "LFRFL-F-RFLFR+F+LFRFL",
    R = "RFLFR+F+LFRFL-F-RFLFR"
  },
  eval = function(self, n)
    local source, result = self.axiom
    for i = 1, n do
      result = ""
      for j = 1, #source do
        local ch = source:sub(j,j)
        result = result .. (self.rules[ch] and self.rules[ch] or ch)
      end
      source = result
    end
    return result
  end
}

function Bitmap:drawPath(path, x, y, dx, dy)
  self:set(x, y, "@")
  for i = 1, #path do
    local ch = path:sub(i,i)
    if (ch == "F") then
      local reps = dx==0 and 1 or 3 -- aspect correction
      for r = 1, reps do
        x, y = x+dx, y+dy
        self:set(x, y, dx==0 and "|" or "-")
      end
      x, y = x+dx, y+dy
      self:set(x, y, "+")
    elseif (ch =="-") then
      dx, dy = dy, -dx
    elseif (ch == "+") then
      dx, dy = -dy, dx
    end
  end
  self:set(x, y, "X")
end

function Bitmap:render()
  for y = 1, self.height do
    print(table.concat(self.pixels[y]))
  end
end

bitmap = Bitmap(53*2,53)
bitmap:clear(" ")
bitmap:drawPath(PeanoLSystem:eval(3), 0, 0, 0, 1)
bitmap:render()
- Output:
@   +---+   +---+   +---+   +---+   +---+   +---+   +---+   +---+   +---+   +---+   +---+   +---+   +---+
|   |   |   |   |   |   |   |   |   |   |   |   |   |   |   |   |   |   |   |   |   |   |   |   |   |   |
+   +   +   +   +   +   +   +   +   +   +   +   +   +   +   +   +   +   +   +   +   +   +   +   +   +   +
|   |   |   |   |   |   |   |   |   |   |   |   |   |   |   |   |   |   |   |   |   |   |   |   |   |   |
+---+   +   +   +---+   +---+   +   +   +---+   +---+   +   +   +---+   +---+   +   +   +---+   +---+   +
        |   |                   |   |                   |   |                   |   |                   |
+---+   +   +   +---+   +---+   +   +   +---+   +---+   +   +   +---+   +---+   +   +   +---+   +---+   +
|   |   |   |   |   |   |   |   |   |   |   |   |   |   |   |   |   |   |   |   |   |   |   |   |   |   |
+   +   +   +   +   +   +   +   +   +   +   +   +   +   +   +   +   +   +   +   +   +   +   +   +   +   +
|   |   |   |   |   |   |   |   |   |   |   |   |   |   |   |   |   |   |   |   |   |   |   |   |   |   |
+   +---+   +---+   +   +   +---+   +---+   +   +   +---+   +---+   +   +   +---+   +---+   +   +   +---+
|                   |   |                   |   |                   |   |                   |   |
+   +---+   +---+   +   +   +---+   +---+   +   +   +---+   +---+   +   +   +---+   +---+   +   +   +---+
|   |   |   |   |   |   |   |   |   |   |   |   |   |   |   |   |   |   |   |   |   |   |   |   |   |   |
+   +   +   +   +   +   +   +   +   +   +   +   +   +   +   +   +   +   +   +   +   +   +   +   +   +   +
|   |   |   |   |   |   |   |   |   |   |   |   |   |   |   |   |   |   |   |   |   |   |   |   |   |   |
+---+   +---+   +---+   +---+   +   +   +---+   +---+   +---+   +---+   +---+   +---+   +---+   +---+   +
                                |   |                                                                   |
+---+   +---+   +---+   +---+   +   +   +---+   +---+   +---+   +---+   +---+   +---+   +---+   +---+   +
|   |   |   |   |   |   |   |   |   |   |   |   |   |   |   |   |   |   |   |   |   |   |   |   |   |   |
+   +   +   +   +   +   +   +   +   +   +   +   +   +   +   +   +   +   +   +   +   +   +   +   +   +   +
|   |   |   |   |   |   |   |   |   |   |   |   |   |   |   |   |   |   |   |   |   |   |   |   |   |   |
+   +---+   +---+   +   +   +---+   +---+   +   +   +---+   +---+   +   +   +---+   +---+   +   +   +---+
|                   |   |                   |   |                   |   |                   |   |
+   +---+   +---+   +   +   +---+   +---+   +   +   +---+   +---+   +   +   +---+   +---+   +   +   +---+
|   |   |   |   |   |   |   |   |   |   |   |   |   |   |   |   |   |   |   |   |   |   |   |   |   |   |
+   +   +   +   +   +   +   +   +   +   +   +   +   +   +   +   +   +   +   +   +   +   +   +   +   +   +
|   |   |   |   |   |   |   |   |   |   |   |   |   |   |   |   |   |   |   |   |   |   |   |   |   |   |
+---+   +   +   +---+   +---+   +   +   +---+   +---+   +   +   +---+   +---+   +   +   +---+   +---+   +
        |   |                   |   |                   |   |                   |   |                   |
+---+   +   +   +---+   +---+   +   +   +---+   +---+   +   +   +---+   +---+   +   +   +---+   +---+   +
|   |   |   |   |   |   |   |   |   |   |   |   |   |   |   |   |   |   |   |   |   |   |   |   |   |   |
+   +   +   +   +   +   +   +   +   +   +   +   +   +   +   +   +   +   +   +   +   +   +   +   +   +   +
|   |   |   |   |   |   |   |   |   |   |   |   |   |   |   |   |   |   |   |   |   |   |   |   |   |   |
+   +---+   +---+   +---+   +---+   +---+   +---+   +---+   +---+   +   +   +---+   +---+   +---+   +---+
|                                                                   |   |
+   +---+   +---+   +---+   +---+   +---+   +---+   +---+   +---+   +   +   +---+   +---+   +---+   +---+
|   |   |   |   |   |   |   |   |   |   |   |   |   |   |   |   |   |   |   |   |   |   |   |   |   |   |
+   +   +   +   +   +   +   +   +   +   +   +   +   +   +   +   +   +   +   +   +   +   +   +   +   +   +
|   |   |   |   |   |   |   |   |   |   |   |   |   |   |   |   |   |   |   |   |   |   |   |   |   |   |
+---+   +   +   +---+   +---+   +   +   +---+   +---+   +   +   +---+   +---+   +   +   +---+   +---+   +
        |   |                   |   |                   |   |                   |   |                   |
+---+   +   +   +---+   +---+   +   +   +---+   +---+   +   +   +---+   +---+   +   +   +---+   +---+   +
|   |   |   |   |   |   |   |   |   |   |   |   |   |   |   |   |   |   |   |   |   |   |   |   |   |   |
+   +   +   +   +   +   +   +   +   +   +   +   +   +   +   +   +   +   +   +   +   +   +   +   +   +   +
|   |   |   |   |   |   |   |   |   |   |   |   |   |   |   |   |   |   |   |   |   |   |   |   |   |   |
+   +---+   +---+   +   +   +---+   +---+   +   +   +---+   +---+   +   +   +---+   +---+   +   +   +---+
|                   |   |                   |   |                   |   |                   |   |
+   +---+   +---+   +   +   +---+   +---+   +   +   +---+   +---+   +   +   +---+   +---+   +   +   +---+
|   |   |   |   |   |   |   |   |   |   |   |   |   |   |   |   |   |   |   |   |   |   |   |   |   |   |
+   +   +   +   +   +   +   +   +   +   +   +   +   +   +   +   +   +   +   +   +   +   +   +   +   +   +
|   |   |   |   |   |   |   |   |   |   |   |   |   |   |   |   |   |   |   |   |   |   |   |   |   |   |
+---+   +---+   +---+   +---+   +---+   +---+   +---+   +---+   +---+   +---+   +---+   +---+   +---+   X
M2000 Interpreter
Draw to M2000 console (which has graphic capabilities). Sub is a copy from freebasic, changed *Line* statement to *Draw to*
Module Peano_curve {
Cls 1, 0
Const Center=2
Report Center, "Peano curve"
let factor=.9, k=3, wi=k^4
let wi2=min.data(scale.x*factor, scale.y*factor), n=wi2/wi
let (dx, dy)=((scale.x-wi2)/2, (scale.y-wi2)/2)
dx+=k*1.2*twipsX
dy+=k*1.2*twipsY
move dx, dy
pen 11 {
      Peano(0,0,wi,0, 0)
}

sub Peano(x, y, lg, i1, i2)
      if lg ==1  then
            draw to  x*n+dx , y*n+dy
            return
      end if
      lg/=k
      Peano(x+2*i1*lg, y+2*i1*lg, lg, i1, i2)
      Peano(x+(i1-i2+1)*lg, y+(i1+i2)*lg, lg, i1, 1-i2)
      Peano(x+lg, y+lg, lg, i1, 1-i2)
      Peano(x+(i1+i2)*lg, y+(i1-i2+1)*lg, lg, 1-i1, 1-i2)
      Peano(x+2*i2*lg, y+2*(1-i2)*lg, lg, i1, i2)
      Peano(x+(1+i2-i1)*lg, y+(2-i1-i2)*lg, lg, i1, i2)
      Peano(x+2*(1-i1)*lg, y+2*(1-i1)*lg, lg, i1, i2)
      Peano(x+(2-i1-i2)*lg, y+(1+i2-i1)*lg, lg, 1-i1, i2)
      Peano(x+2*(1-i2)*lg, y+2*i2*lg, lg, 1-i1, i2)
end sub
}
Peano_curveMathematica/Wolfram Language
Graphics[PeanoCurve[4]]
- Output:
Outputs a graphical representation of a 4th order PeanoCurve.
Nim
import imageman

const Width = 81

proc peano(points: var seq[Point]; x, y, lg, i1, i2: int) =

  if lg == 1:
    points.add ((Width - x) * 10, (Width - y) * 10)
    return

  let lg = lg div 3
  points.peano(x + 2 * i1 * lg, y + 2 * i1 * lg, lg, i1, i2)
  points.peano(x + (i1 - i2 + 1) * lg, y + (i1 + i2) * lg, lg, i1, 1 - i2)
  points.peano(x + lg, y + lg, lg, i1, 1 - i2)
  points.peano(x + (i1 + i2) * lg, y + (i1 - i2 + 1) * lg, lg, 1 - i1, 1 - i2)
  points.peano(x + 2 * i2 * lg, y + 2 * (1-i2) * lg, lg, i1, i2)
  points.peano(x + (1 + i2 - i1) * lg, y + (2 - i1 - i2) * lg, lg, i1, i2)
  points.peano(x + 2 * (1 - i1) * lg, y + 2 * (1 - i1) * lg, lg, i1, i2)
  points.peano(x + (2 - i1 - i2) * lg, y + (1 + i2 - i1) * lg, lg, 1 - i1, i2)
  points.peano(x + 2 * (1 - i2) * lg, y + 2 * i2 * lg, lg, 1 - i1, i2)


var points: seq[Point]
points.peano(0, 0, Width, 0, 0)
var image = initImage[ColorRGBU](820, 820)
let color = ColorRGBU([byte 255, 255, 0])
for i in 1..points.high:
  image.drawLine(points[i - 1], points[i], color)
image.savePNG("peano.png", compression = 9)
Perl
use SVG;
use List::Util qw(max min);

use constant pi => 2 * atan2(1, 0);

# Compute the curve with a Lindemayer-system
my %rules = (
    L => 'LFRFL-F-RFLFR+F+LFRFL',
    R => 'RFLFR+F+LFRFL-F-RFLFR'
);
my $peano = 'L';
$peano =~ s/([LR])/$rules{$1}/eg for 1..4;

# Draw the curve in SVG
($x, $y) = (0, 0);
$theta   = pi/2;
$r       = 4;

for (split //, $peano) {
    if (/F/) {
        push @X, sprintf "%.0f", $x;
        push @Y, sprintf "%.0f", $y;
        $x += $r * cos($theta);
        $y += $r * sin($theta);
    }
    elsif (/\+/) { $theta += pi/2; }
    elsif (/\-/) { $theta -= pi/2; }
}

$max =  max(@X,@Y);
$xt  = -min(@X)+10;
$yt  = -min(@Y)+10;
$svg = SVG->new(width=>$max+20, height=>$max+20);
$points = $svg->get_path(x=>\@X, y=>\@Y, -type=>'polyline');
$svg->rect(width=>"100%", height=>"100%", style=>{'fill'=>'black'});
$svg->polyline(%$points, style=>{'stroke'=>'orange', 'stroke-width'=>1}, transform=>"translate($xt,$yt)");

open  $fh, '>', 'peano_curve.svg';
print $fh  $svg->xmlify(-namespace=>'svg');
close $fh;
Peano curve (offsite image)
Phix
You can run this online here. Space key toggles between switchback and meander curves.
--
-- demo\rosetta\peano_curve.exw
-- ============================
--
--  Draws a peano curve. Space key toggles between switchback and meander curves.
--
with javascript_semantics
include pGUI.e

Ihandle dlg, canvas
cdCanvas cddbuffer, cdcanvas

bool meander = false    -- space toggles (false==draw switchback curve)
constant width = 81

sequence points = {}

-- switchback peano:
--
-- There are (as per wp) four shapes to draw:
--
--  1: +-v ^     2: ^ v-+     3: v ^-+     2: +-^ v
--     | | |        | | |        | | |        | | |
--     ^ v-+        +-v ^        +-^ v        v ^-+
--
-- 1 starts bottom left, ends top right
-- 2 starts bottom right, ends top left
-- 3 starts top left, ends bottom right
-- 4 starts top right, ends bottom left
--
-- given the centre point (think {1,1}), and using {0,0} as the bottom left:
--
constant shapes = {{{-1,-1},{-1,0},{-1,+1},{0,+1},{0,0},{0,-1},{+1,-1},{+1,0},{+1,+1}},
                   {{+1,-1},{+1,0},{+1,+1},{0,+1},{0,0},{0,-1},{-1,-1},{-1,0},{-1,+1}},     -- (== sq_mul(shapes[1],{-1,0}))
                   {{-1,+1},{-1,0},{-1,-1},{0,-1},{0,0},{0,+1},{+1,+1},{+1,0},{+1,-1}},     -- (== reverse(shapes[2]))
                   {{+1,+1},{+1,0},{+1,-1},{0,-1},{0,0},{0,+1},{-1,+1},{-1,0},{-1,-1}}}     -- (== reverse(shapes[1]))

constant subshapes = {{1,2,1,3,4,3,1,2,1},
                      {2,1,2,4,3,4,2,1,2},      -- == sq_sub({3,3,3,7,7,7,3,3,3},subshapes[1])
                      {3,4,3,1,2,1,3,4,3},      -- == sq_sub(5,subshapes[2])
                      {4,3,4,2,1,2,4,3,4}}      -- == sq_sub(5,subshapes[1])

-- As noted, it should theoretically be possible to simplify/shorten/remove/inline those tables

procedure switchback_peano(integer x, y, level, shape)
-- (written from scratch, with a nod to the meander algorithm [below])
    if level<=1 then
        points = append(points, {x*10, y*10})
        return
    end if
    level /= 3
    for i=1 to 9 do
        integer {dx,dy} = shapes[shape][i]
        switchback_peano(x+dx*level,y+dy*level,level,subshapes[shape][i])
    end for
end procedure

procedure meander_peano(integer x, y, lg, i1, i2)
-- (translated from Go)
    if lg=1 then
        integer px := (width-x) * 10,
                py := (width-y) * 10
        points = append(points, {px, py})
        return
    end if
    lg /= 3
    meander_peano(x+2*i1*lg, y+2*i1*lg, lg, i1, i2)
    meander_peano(x+(i1-i2+1)*lg, y+(i1+i2)*lg, lg, i1, 1-i2)
    meander_peano(x+lg, y+lg, lg, i1, 1-i2)
    meander_peano(x+(i1+i2)*lg, y+(i1-i2+1)*lg, lg, 1-i1, 1-i2)
    meander_peano(x+2*i2*lg, y+2*(1-i2)*lg, lg, i1, i2)
    meander_peano(x+(1+i2-i1)*lg, y+(2-i1-i2)*lg, lg, i1, i2)
    meander_peano(x+2*(1-i1)*lg, y+2*(1-i1)*lg, lg, i1, i2)
    meander_peano(x+(2-i1-i2)*lg, y+(1+i2-i1)*lg, lg, 1-i1, i2)
    meander_peano(x+2*(1-i2)*lg, y+2*i2*lg, lg, 1-i1, i2)
end procedure

function redraw_cb(Ihandle /*ih*/, integer /*posx*/, /*posy*/)
    if length(points)=0 then
        if meander then
            meander_peano(0, 0, width, 0, 0)
        else
            switchback_peano(41, 41, width, 1)
        end if
    end if
    cdCanvasActivate(cddbuffer)
    cdCanvasBegin(cddbuffer, CD_OPEN_LINES)
    for i=1 to length(points) do
        integer {x,y} = points[i]
        cdCanvasVertex(cddbuffer, x, y)
    end for
    cdCanvasEnd(cddbuffer)
    cdCanvasFlush(cddbuffer)
    return IUP_DEFAULT
end function

function map_cb(Ihandle ih)
    cdcanvas = cdCreateCanvas(CD_IUP, ih)
    cddbuffer = cdCreateCanvas(CD_DBUFFER, cdcanvas)
    cdCanvasSetBackground(cddbuffer, CD_WHITE)
    cdCanvasSetForeground(cddbuffer, CD_MAGENTA)
    return IUP_DEFAULT
end function

function key_cb(Ihandle /*ih*/, atom c)
    if c=K_ESC then return IUP_CLOSE end if
    if c=' ' then
        meander = not meander
        points = {}
        cdCanvasClear(cddbuffer)
        IupUpdate(canvas)
    end if
    return IUP_CONTINUE
end function

procedure main()
    IupOpen()
    canvas = IupCanvas("RASTERSIZE=822x822")
    IupSetCallbacks(canvas, {"MAP_CB", Icallback("map_cb"),
                             "ACTION", Icallback("redraw_cb")})
    dlg = IupDialog(canvas,`TITLE="Peano Curve"`)
    IupSetAttribute(dlg, "DIALOGFRAME", "YES")  -- no resize here
    IupSetCallback(dlg, "KEY_CB", Icallback("key_cb"))
    IupShow(dlg)
    if platform()!=JS then
        IupMainLoop()
        IupClose()
    end if
end procedure

main()
Processing
//Abhishek Ghosh, 28th June 2022

void Peano(int x, int y, int lg, int i1, int i2) {

  if (lg == 1) {
    ellipse(x,y,1,1);
    return;
  }

  lg = lg/3;
  Peano(x+(2*i1*lg), y+(2*i1*lg), lg, i1, i2);
  Peano(x+((i1-i2+1)*lg), y+((i1+i2)*lg), lg, i1, 1-i2);
  Peano(x+lg, y+lg, lg, i1, 1-i2);
  Peano(x+((i1+i2)*lg), y+((i1-i2+1)*lg), lg, 1-i1, 1-i2);
  Peano(x+(2*i2*lg), y+(2*(1-i2)*lg), lg, i1, i2);
  Peano(x+((1+i2-i1)*lg), y+((2-i1-i2)*lg), lg, i1, i2);
  Peano(x+(2*(1-i1)*lg), y+(2*(1-i1)*lg), lg, i1, i2);
  Peano(x+((2-i1-i2)*lg), y+((1+i2-i1)*lg), lg, 1-i1, i2);
  Peano(x+(2*(1-i2)*lg), y+(2*i2*lg), lg, 1-i1, i2);
}

void setup(){
  size(1000,1000);
  Peano(0, 0, 1000, 0, 0);
}
Prolog
main:-
    write_peano_curve('peano_curve.svg', 656, 4).

write_peano_curve(File, Size, Order):-
    open(File, write, Stream),
    format(Stream,
           "<svg xmlns='http://www.w3.org/2000/svg' width='~d' height='~d'>\n",
           [Size, Size]),
    write(Stream, "<rect width='100%' height='100%' fill='white'/>\n"),
    peano_curve(Stream, "L", 8, 8, 8, 90, Order),
    write(Stream, "</svg>\n"),
    close(Stream).

peano_curve(Stream, Axiom, X, Y, Length, Angle, Order):-
    write(Stream, "<path stroke-width='1' stroke='black' fill='none' d='"),
    format(Stream, 'M~g,~g\n', [X, Y]),
    rewrite(Axiom, Order, S),
    string_chars(S, Chars),
    execute(Stream, X, Y, Length, Angle, Chars),
    write(Stream, "'/>\n").

rewrite(S, 0, S):-!.
rewrite(S0, N, S):-
    string_chars(S0, Chars0),
    rewrite1(Chars0, '', S1),
    N1 is N - 1,
    rewrite(S1, N1, S).

rewrite1([], S, S):-!.
rewrite1([C|Chars], T, S):-
    rewrite2(C, X),
    string_concat(T, X, T1),
    rewrite1(Chars, T1, S).

rewrite2('L', "LFRFL-F-RFLFR+F+LFRFL"):-!.
rewrite2('R', "RFLFR+F+LFRFL-F-RFLFR"):-!.
rewrite2(X, X).

execute(_, _, _, _, _, []):-!.
execute(Stream, X, Y, Length, Angle, ['F'|Chars]):-
    !,
    Theta is (pi * Angle) / 180.0,
    X1 is X + Length * cos(Theta),
    Y1 is Y + Length * sin(Theta),
    format(Stream, 'L~g,~g\n', [X1, Y1]),
    execute(Stream, X1, Y1, Length, Angle, Chars).
execute(Stream, X, Y, Length, Angle, ['+'|Chars]):-
    !,
    Angle1 is (Angle + 90) mod 360,
    execute(Stream, X, Y, Length, Angle1, Chars).
execute(Stream, X, Y, Length, Angle, ['-'|Chars]):-
    !,
    Angle1 is (Angle - 90) mod 360,
    execute(Stream, X, Y, Length, Angle1, Chars).
execute(Stream, X, Y, Length, Angle, [_|Chars]):-
    execute(Stream, X, Y, Length, Angle, Chars).
- Output:
Python
This implementation is, as I think, a variant of the Peano curve (just because it's different in the images). And it's supposed to be like a fullscreen app. And because of scale, the "steps" of the curve will be different in horizontal and vertical (it'll be quite nice if your screen is square :D). If peano(4) (in the last line of code) is runned with the input higher than 8, the void between the steps will be filled with steps, and the hole screen will fill (of course, this depends of your screen size). It's also produces a graphic with the current stack pilled, timed by the current function runned.
import turtle as tt
import inspect

stack = [] # Mark the current stacks in run.
def peano(iterations=1):
    global stack

    # The turtle Ivan:
    ivan = tt.Turtle(shape = "classic", visible = True)


    # The app window:
    screen = tt.Screen()
    screen.title("Desenhin do Peano")
    screen.bgcolor("#232323")
    screen.delay(0) # Speed on drawing (if higher, more slow)
    screen.setup(width=0.95, height=0.9)

    # The size of each step walked (here, named simply "walk"). It's not a pixel scale. This may stay still:
    walk = 1

    def screenlength(k):
        # A function to make the image good to see (without it would result in a partial image).
        # This will guarantee that we can see the the voids and it's steps.
        if k != 0:
            length = screenlength(k-1)
            return 2*length + 1
        else: return 0

    kkkj = screenlength(iterations)
    screen.setworldcoordinates(-1, -1, kkkj + 1, kkkj + 1)
    ivan.color("#EEFFFF", "#FFFFFF")


    # The magic  \(^-^)/:
    def step1(k):
        global stack
        stack.append(len(inspect.stack()))
        if k != 0:
            ivan.left(90)
            step2(k - 1)
            ivan.forward(walk)
            ivan.right(90)
            step1(k - 1)
            ivan.forward(walk)
            step1(k - 1)
            ivan.right(90)
            ivan.forward(walk)
            step2(k - 1)
            ivan.left(90)
    def step2(k):
        global stack
        stack.append(len(inspect.stack()))
        if k != 0:
            ivan.right(90)
            step1(k - 1)
            ivan.forward(walk)
            ivan.left(90)
            step2(k - 1)
            ivan.forward(walk)
            step2(k - 1)
            ivan.left(90)
            ivan.forward(walk)
            step1(k - 1)
            ivan.right(90)

    # Making the program work:
    ivan.left(90)
    step2(iterations)

    tt.done()

if __name__ == "__main__":
    peano(4)
    import pylab as P # This plot, after closing the drawing window, the "stack" graphic.
    P.plot(stack)
    P.show()
You can see the output image here and the output stack graphic here.
Quackery
  [ $ "turtleduck.qky" loadfile ] now!

  [ stack ]                      is switch.arg (   --> [ )

  [ switch.arg put ]             is switch     ( x -->   )

  [ switch.arg release ]         is otherwise  (   -->   )

  [ switch.arg share
    != iff ]else[ done
    otherwise ]'[ do ]done[ ]    is case       ( x -->   )

  [ $ "" swap witheach
      [ nested quackery join ] ] is expand     ( $ --> $ )

  [ $ "F" ]                      is F          ( $ --> $ )

  [ $ "L" ]                      is L          ( $ --> $ )

  [ $ "R" ]                      is R          ( $ --> $ )

  [ $ "AFBFARFRBFAFBLFLAFBFA" ]  is A          ( $ --> $ )

  [ $ "BFAFBLFLAFBFARFRBFAFB" ]  is B          ( $ --> $ )

  $ "A"

  4 times expand

  turtle
  witheach
    [ switch
        [ char F case [  4 1 walk ]
          char L case [ -1 4 turn ]
          char R case [  1 4 turn ]
otherwise ( ignore ) ] ]- Output:

R
HilberCurve Library from bioconductor is used to produce 4th order peano curve, for more details please refer to Bioconductor[1]
#to install hilbercurve library, biocmanager needs to be installed first
install.packages("BiocManager")
BiocManager::install("HilbertCurve")
#loading library and setting seed for random numbers
library(HilbertCurve)
library(circlize)
set.seed(123)

#4th order peano curve is generated
for(i in 1:512) {
  peano = HilbertCurve(1, 512, level = 4, reference = TRUE, arrow = FALSE)
  hc_points(peano, x1 = i, np = NULL, pch = 16, size = unit(3, "mm"))
}
Racket
Draw the Peano curve using the classical turtle style known from Logo.
The MetaPict library is used to implement a turtle.
See also https://pdfs.semanticscholar.org/fee6/187cc2dd1679d4976db9522b06a49f63be46.pdf
/* Jens Axel Søgaard, 27th December 2018*/
#lang racket
(require metapict metapict/mat)

;;; Turtle State
(define p (pt 0 0))  ; current position
(define d (vec 0 1)) ; current direction
(define c '())       ; line segments drawn so far

;;; Turtle Operations
(define (jump q)    (set! p q))
(define (move q)    (set! c (cons (curve p -- q) c)) (set! p q))
(define (forward x) (move (pt+ p (vec* x d))))
(define (left  a)   (set! d (rot a d)))
(define (right a)   (left (- a)))

;;; Peano
(define (peano n a h)
  (unless (= n 0)
    (right a)
    (peano (- n 1) (- a) h)
    (forward h)
    (peano (- n 1) a h)
    (forward h)
    (peano (- n 1) (- a) h)
    (left a)))

;;; Produce image
(set-curve-pict-size 400 400)
(with-window (window -1 81 -1 82)
  (peano 6 90 3)
  (draw* c))
Raku
(formerly Perl 6)
use SVG;
role Lindenmayer {
has %.rules;
method succ {
self.comb.map( { %!rules{$^c} // $c } ).join but Lindenmayer(%!rules)
}
}
my $peano = 'L' but Lindenmayer( { 'L' => 'LFRFL-F-RFLFR+F+LFRFL', 'R' => 'RFLFR+F+LFRFL-F-RFLFR' } );
$peano++ xx 4;
my @points = (10, 10);
for $peano.comb {
state ($x, $y) = @points[0,1];
state $d = 0 + 8i;
when 'F' { @points.append: ($x += $d.re).round(1), ($y += $d.im).round(1) }
when /< + - >/ { $d *= "{$_}1i" }
default { }
}
say SVG.serialize(
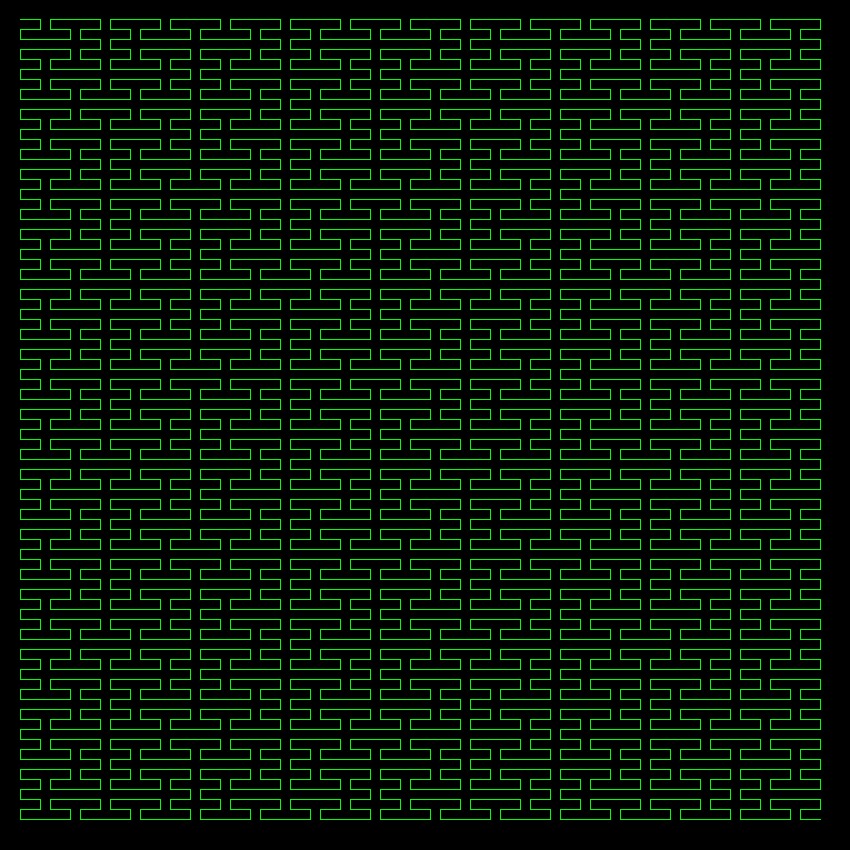
svg => [
:660width, :660height, :style<stroke:lime>,
:rect[:width<100%>, :height<100%>, :fill<black>],
:polyline[ :points(@points.join: ','), :fill<black> ],
],
);
See: Peano curve (SVG image)
Ruby
Implemented as a Lindenmayer System, depends on JRuby or JRubyComplete see Hilbert for grammar
load_library :grammar

# Peano class
class Peano
  include Processing::Proxy
  attr_reader :draw_length, :vec, :theta, :axiom, :grammar
  DELTA = 60 # degrees
  def initialize(vec)
    @axiom = 'XF' # Axiom
    rules = {
      'X' => 'X+YF++YF-FX--FXFX-YF+', # LSystem Rules
      'Y' => '-FX+YFYF++YF+FX--FX-Y'
    }
    @grammar = Grammar.new(axiom, rules)
    @theta   = 0
    @draw_length = 100
    @vec = vec
  end

  def generate(gen)
    @draw_length = draw_length * 0.6**gen
    grammar.generate gen
  end

  def translate_rules(prod)
    coss = ->(orig, alpha, len) { orig + len * DegLut.cos(alpha) }
    sinn = ->(orig, alpha, len) { orig - len * DegLut.sin(alpha) }
    [].tap do |pts| # An array to store line vertices as Vec2D
      prod.scan(/./) do |ch|
        case ch
        when 'F'
          pts << vec.copy
          @vec = Vec2D.new(
            coss.call(vec.x, theta, draw_length),
            sinn.call(vec.y, theta, draw_length)
          )
          pts << vec
        when '+'
          @theta += DELTA
        when '-'
          @theta -= DELTA
        when 'X', 'Y'
        else
          puts("character #{ch} not in grammar")
        end
      end
    end
  end
end

attr_reader :points

def setup
  sketch_title 'Peano'
  peano = Peano.new(Vec2D.new(width * 0.65, height * 0.9))
  production = peano.generate 4 # 4 generations looks OK
  @points = peano.translate_rules(production)
  no_loop
end

def draw
  background(0)
  render points
end

def render(points)
  no_fill
  stroke 200.0
  stroke_weight 3
  begin_shape
  points.each_slice(2) do |v0, v1|
    v0.to_vertex(renderer)
    v1.to_vertex(renderer)
  end
  end_shape
end

def renderer
  @renderer ||= GfxRender.new(g)
end

def settings
  size(800, 800)
end
Rust
// [dependencies]
// svg = "0.8.0"

use svg::node::element::path::Data;
use svg::node::element::Path;

struct PeanoCurve {
    current_x: f64,
    current_y: f64,
    current_angle: i32,
    line_length: f64,
}

impl PeanoCurve {
    fn new(x: f64, y: f64, length: f64, angle: i32) -> PeanoCurve {
        PeanoCurve {
            current_x: x,
            current_y: y,
            current_angle: angle,
            line_length: length,
        }
    }
    fn rewrite(order: usize) -> String {
        let mut str = String::from("L");
        for _ in 0..order {
            let mut tmp = String::new();
            for ch in str.chars() {
                match ch {
                    'L' => tmp.push_str("LFRFL-F-RFLFR+F+LFRFL"),
                    'R' => tmp.push_str("RFLFR+F+LFRFL-F-RFLFR"),
                    _ => tmp.push(ch),
                }
            }
            str = tmp;
        }
        str
    }
    fn execute(&mut self, order: usize) -> Path {
        let mut data = Data::new().move_to((self.current_x, self.current_y));
        for ch in PeanoCurve::rewrite(order).chars() {
            match ch {
                'F' => data = self.draw_line(data),
                '+' => self.turn(90),
                '-' => self.turn(-90),
                _ => {}
            }
        }
        Path::new()
            .set("fill", "none")
            .set("stroke", "black")
            .set("stroke-width", "1")
            .set("d", data)
    }
    fn draw_line(&mut self, data: Data) -> Data {
        let theta = (self.current_angle as f64).to_radians();
        self.current_x += self.line_length * theta.cos();
        self.current_y += self.line_length * theta.sin();
        data.line_to((self.current_x, self.current_y))
    }
    fn turn(&mut self, angle: i32) {
        self.current_angle = (self.current_angle + angle) % 360;
    }
    fn save(file: &str, size: usize, order: usize) -> std::io::Result<()> {
        use svg::node::element::Rectangle;
        let rect = Rectangle::new()
            .set("width", "100%")
            .set("height", "100%")
            .set("fill", "white");
        let mut p = PeanoCurve::new(8.0, 8.0, 8.0, 90);
        let document = svg::Document::new()
            .set("width", size)
            .set("height", size)
            .add(rect)
            .add(p.execute(order));
        svg::save(file, &document)
    }
}

fn main() {
    PeanoCurve::save("peano_curve.svg", 656, 4).unwrap();
}
- Output:
Sidef
Uses the LSystem class defined at Hilbert curve.
var rules = Hash(
    l => 'lFrFl-F-rFlFr+F+lFrFl',
    r => 'rFlFr+F+lFrFl-F-rFlFr',
)

var lsys = LSystem(
    width:  500,
    height: 500,

    xoff: -50,
    yoff: -50,

    len:   5,
    angle: 90,
    color: 'dark green',
)

lsys.execute('l', 4, "peano_curve.png", rules)
Output image: Peano curve
VBA
Const WIDTH = 243 'a power of 3 for a evenly spaced curve
Dim n As Long
Dim points() As Single
Dim flag As Boolean
'Store the coordinate pairs (x, y) generated by Peano into
'a SafeArrayOfPoints with lineto. The number of points
'generated depend on WIDTH. Peano is called twice. Once
'to count the number of points, and twice to generate
'the points after the dynamic array has been
'redimensionalised.
'VBA doesn't have a lineto method. Instead of AddLine, which
'requires four parameters, including the begin pair of
'coordinates, the method AddPolyline is used, which is
'called from main after all the points are generated.
'This creates a single object, whereas AddLine would
'create thousands of small unconnected line objects.
Private Sub lineto(x As Integer, y As Integer)
    If flag Then
        points(n, 1) = x
        points(n, 2) = y
    End If
    n = n + 1
End Sub
Private Sub Peano(ByVal x As Integer, ByVal y As Integer, ByVal lg As Integer, _
    ByVal i1 As Integer, ByVal i2 As Integer)
    If (lg = 1) Then
        Call lineto(x * 3, y * 3)
        Exit Sub
    End If
    lg = lg / 3
    Call Peano(x + (2 * i1 * lg), y + (2 * i1 * lg), lg, i1, i2)
    Call Peano(x + ((i1 - i2 + 1) * lg), y + ((i1 + i2) * lg), lg, i1, 1 - i2)
    Call Peano(x + lg, y + lg, lg, i1, 1 - i2)
    Call Peano(x + ((i1 + i2) * lg), y + ((i1 - i2 + 1) * lg), lg, 1 - i1, 1 - i2)
    Call Peano(x + (2 * i2 * lg), y + (2 * (1 - i2) * lg), lg, i1, i2)
    Call Peano(x + ((1 + i2 - i1) * lg), y + ((2 - i1 - i2) * lg), lg, i1, i2)
    Call Peano(x + (2 * (1 - i1) * lg), y + (2 * (1 - i1) * lg), lg, i1, i2)
    Call Peano(x + ((2 - i1 - i2) * lg), y + ((1 + i2 - i1) * lg), lg, 1 - i1, i2)
    Call Peano(x + (2 * (1 - i2) * lg), y + (2 * i2 * lg), lg, 1 - i1, i2)
End Sub
Sub main()
    n = 1: flag = False
    Call Peano(0, 0, WIDTH, 0, 0) 'Start Peano recursion to count number of points
    ReDim points(1 To n - 1, 1 To 2)
    n = 1: flag = True
    Call Peano(0, 0, WIDTH, 0, 0) 'Start Peano recursion to generate and store points
    ActiveSheet.Shapes.AddPolyline points 'Excel assumed
End Sub
VBScript
VBSCript does'nt have access to Windows graphics so I write SVG commands into an HML file and display it using the default browser. A turtle graphics class makes the recursive definition of the curve easy.
option explicit
'outputs turtle graphics to svg file and opens it

const pi180= 0.01745329251994329576923690768489 ' pi/180
const pi=3.1415926535897932384626433832795 'pi
class turtle

   dim fso
   dim fn
   dim svg

   dim iang  'radians
   dim ori   'radians
   dim incr
   dim pdown
   dim clr
   dim x
   dim y

   public property let orient(n):ori = n*pi180 :end property
   public property let iangle(n):iang= n*pi180 :end property
   public sub pd() : pdown=true: end sub
   public sub pu()  :pdown=FALSE :end sub

   public sub rt(i)
     ori=ori - i*iang:
     if ori<0 then ori = ori+pi*2
   end sub
   public sub lt(i):
     ori=(ori + i*iang)
     if ori>(pi*2) then ori=ori-pi*2
   end sub

   public sub bw(l)
      x= x+ cos(ori+pi)*l*incr
      y= y+ sin(ori+pi)*l*incr
   end sub

   public sub fw(l)
      dim x1,y1
      x1=x + cos(ori)*l*incr
      y1=y + sin(ori)*l*incr
      if pdown then line x,y,x1,y1
      x=x1:y=y1
   end sub

   Private Sub Class_Initialize()
      setlocale "us"
      initsvg
      pdown=true
   end sub

   Private Sub Class_Terminate()
      disply
   end sub

   private sub line (x,y,x1,y1)
      svg.WriteLine "<line x1=""" & x & """ y1= """& y & """ x2=""" & x1& """ y2=""" & y1 & """/>"
   end sub

   private sub disply()
       dim shell
       svg.WriteLine "</svg></body></html>"
       svg.close
       Set shell = CreateObject("Shell.Application")
       shell.ShellExecute fn,1,False
   end sub

   private sub initsvg()
     dim scriptpath
     Set fso = CreateObject ("Scripting.Filesystemobject")
     ScriptPath= Left(WScript.ScriptFullName, InStrRev(WScript.ScriptFullName, "\"))
     fn=Scriptpath & "SIERP.HTML"
     Set svg = fso.CreateTextFile(fn,True)
     if SVG IS nothing then wscript.echo "Can't create svg file" :vscript.quit
     svg.WriteLine "<!DOCTYPE html>" &vbcrlf & "<html>" &vbcrlf & "<head>"
     svg.writeline "<style>" & vbcrlf & "line {stroke:rgb(255,0,0);stroke-width:.5}" &vbcrlf &"</style>"
     svg.writeline "</head>"&vbcrlf & "<body>"
     svg.WriteLine "<svg xmlns=""http://www.w3.org/2000/svg"" width=""800"" height=""800"" viewBox=""0 0 800 800"">"
   end sub
end class

sub peano (n,a)
  if n=0 then exit sub
  x.rt a
  peano n-1, -a
  x.fw 1
  peano n-1, a
  x.fw 1
  peano n-1, -a
  x.lt a
end sub

 dim x,i
set x=new turtle
x.iangle=90
x.orient=0
x.incr=7
x.x=100:x.y=500
peano 7,1
set x=nothing  'show image in browser
Wren
import "graphics" for Canvas, Color, Point
import "dome" for Window

class Game {
    static init() {
        Window.title = "Peano curve"
        Canvas.resize(820, 820)
        Window.resize(820, 820)
        Canvas.cls(Color.white) // white background
        __points = []
        __width = 81
        peano(0, 0, __width, 0, 0)
        var col = Color.rgb(255, 0, 255) // magenta
        var prev = __points[0]
        for (p in __points.skip(1)) {
            var curr = p
            Canvas.line(prev.x, prev.y, curr.x, curr.y, col)
            prev = curr
        }
    }

    static peano(x, y, lg, i1, i2) {
        if (lg == 1) {
            var px = (__width - x) * 10
            var py = (__width - y) * 10
            __points.add(Point.new(px, py))
            return
        }
        lg = (lg/3).floor
        peano(x+2*i1*lg, y+2*i1*lg, lg, i1, i2)
        peano(x+(i1-i2+1)*lg, y+(i1+i2)*lg, lg, i1, 1-i2)
        peano(x+lg, y+lg, lg, i1, 1-i2)
        peano(x+(i1+i2)*lg, y+(i1-i2+1)*lg, lg, 1-i1, 1-i2)
        peano(x+2*i2*lg, y+2*(1-i2)*lg, lg, i1, i2)
        peano(x+(1+i2-i1)*lg, y+(2-i1-i2)*lg, lg, i1, i2)
        peano(x+2*(1-i1)*lg, y+2*(1-i1)*lg, lg, i1, i2)
        peano(x+(2-i1-i2)*lg, y+(1+i2-i1)*lg, lg, 1-i1, i2)
        peano(x+2*(1-i2)*lg, y+2*i2*lg, lg, 1-i1, i2)
    }

    static update() {}

    static draw(dt) {}
}
XPL0
proc Peano(X, Y, Lg, I1, I2);
int  X, Y, Lg, I1, I2;
[if Lg = 1 then
    [Line(3*X, 3*Y, 11 \cyan\);
    return;
    ];
Lg:= Lg/3;
Peano(X + 2*I1*     Lg,  Y + 2*I1*     Lg,  Lg,  I1,    I2);
Peano(X + (I1-I2+1)*Lg,  Y + (I1+I2)*  Lg,  Lg,  I1,    1-I2);
Peano(X +           Lg,  Y +           Lg,  Lg,  I1,    1-I2);
Peano(X + (I1+I2)*  Lg,  Y + (I1-I2+1)*Lg,  Lg,  1-I1,  1-I2);
Peano(X + 2*I2*     Lg,  Y + 2*(1-I2)* Lg,  Lg,  I1,    I2);
Peano(X + (1+I2-I1)*Lg,  Y + (2-I1-I2)*Lg,  Lg,  I1,    I2);
Peano(X + 2*(1-I1)* Lg,  Y + 2*(1-I1)* Lg,  Lg,  I1,    I2);
Peano(X + (2-I1-I2)*Lg,  Y + (1+I2-I1)*Lg,  Lg,  1-I1,  I2);
Peano(X + 2*(1-I2)* Lg,  Y + 2*I2*     Lg,  Lg,  1-I1,  I2);
];

[SetVid($13);
Peano(0, 0, 3*3*3*3, 0, 0);     \start Peano recursion
]- Output:

Yabasic
WIDTH = 243 //a power of 3 for a evenly spaced curve

open window 700, 700

Peano(0, 0, WIDTH, 0, 0)

Sub Peano(x, y, lg, i1, i2)
    If (lg = 1) Then
        line x * 3, y * 3
        return
    End If
    lg = lg / 3
    Peano(x + (2 * i1 * lg), y + (2 * i1 * lg), lg, i1, i2)
    Peano(x + ((i1 - i2 + 1) * lg), y + ((i1 + i2) * lg), lg, i1, 1 - i2)
    Peano(x + lg, y + lg, lg, i1, 1 - i2)
    Peano(x + ((i1 + i2) * lg), y + ((i1 - i2 + 1) * lg), lg, 1 - i1, 1 - i2)
    Peano(x + (2 * i2 * lg), y + (2 * (1 - i2) * lg), lg, i1, i2)
    Peano(x + ((1 + i2 - i1) * lg), y + ((2 - i1 - i2) * lg), lg, i1, i2)
    Peano(x + (2 * (1 - i1) * lg), y + (2 * (1 - i1) * lg), lg, i1, i2)
    Peano(x + ((2 - i1 - i2) * lg), y + ((1 + i2 - i1) * lg), lg, 1 - i1, i2)
    Peano(x + (2 * (1 - i2) * lg), y + (2 * i2 * lg), lg, 1 - i1, i2)
End Sub
zkl
Using a Lindenmayer system and turtle graphics & turned 90°:
lsystem("L",					// axiom
  Dictionary("L","LFRFL-F-RFLFR+F+LFRFL", "R","RFLFR+F+LFRFL-F-RFLFR"), # rules
  "+-F", 4)				  	// constants, order
: turtle(_);

fcn lsystem(axiom,rules,consts,n){	// Lindenmayer system --> string
   foreach k in (consts){ rules.add(k,k) }
   buf1,buf2 := Data(Void,axiom).howza(3), Data().howza(3);  // characters
   do(n){
      buf1.pump(buf2.clear(), rules.get);
      t:=buf1; buf1=buf2; buf2=t;	// swap buffers
   }
   buf1.text		// n=4 --> 16,401  characters
}
Using Image Magick and the PPM class from http://rosettacode.org/wiki/Bitmap/Bresenham%27s_line_algorithm#zkl
fcn turtle(koch){
   const D=10.0;
   dir,angle, x,y := 0.0, (90.0).toRad(), 20.0, 830.0; // turtle; x,y are float
   img,color := PPM(850,850), 0x00ff00;
   foreach c in (koch){
      switch(c){
	 case("F"){   // draw forward
	    dx,dy := D.toRectangular(dir);
	    tx,ty := x,y; x,y = (x+dx),(y+dy);
	    img.line(tx.toInt(),ty.toInt(), x.toInt(),y.toInt(), color);
	 }
	 case("-"){ dir-=angle } // turn right
	 case("+"){ dir+=angle } // turn left
      }
   }
   img.writeJPGFile("peanoCurve.zkl.jpg");
}- Output:
Image at Peano curve
- Programming Tasks
- Fractals
- Action!
- Ada
- APDF
- ALGOL 68
- ALGOL 68-l-system
- AutoHotkey
- C
- C++
- EasyLang
- Factor
- Fōrmulæ
- FreeBASIC
- FutureBasic
- Go
- Go Graphics
- IS-BASIC
- J
- Java
- Jq
- Julia
- Lua
- M2000 Interpreter
- Mathematica
- Wolfram Language
- Nim
- Imageman
- Perl
- Phix
- Phix/pGUI
- Phix/online
- Processing
- Prolog
- Python
- Turtle
- Quackery
- R
- Racket
- Raku
- Ruby
- RubyGems
- JRubyArt
- Rust
- Sidef
- VBA
- VBScript
- Wren
- DOME
- XPL0
- Yabasic
- Zkl