
Goldbach's comet: Difference between revisions
(make graph point marker size smaller) |
|||
Line 276:
The value of G(1000000) is 5402
</pre>
=={{header|Python}}==
<lang python>from matplotlib.pyplot import scatter
from sympy import isprime
def prime_duo_partitions(n):
if isprime(n):
yield (n,)
for i in range(1, n//2 + 1):
if isprime(i) and isprime(n - i):
yield (i, n - i)
def g(n):
assert n > 2 and n % 2 == 0, 'n in goldbach function g(n) must be even'
return len(list(prime_duo_partitions(n)))
print('The first 100 G numbers are:')
col = 1
for n in range(4, 204, 2):
print(str(g(n)).ljust(4), end = '\n' if (col % 10 == 0) else '')
col += 1
print('\nThe value of G(1000000) is', g(1_000_000))
x = range(4, 4002, 2)
y = [g(i) for i in x]
colors = [["red", "blue", "green"][(i // 2) % 3] for i in x]
scatter([i // 2 for i in x], y, marker='.', color = colors)
</lang>{{out}}
<pre>
The first 100 G numbers are:
1 1 1 2 1 2 2 2 2 3
3 3 2 3 2 4 4 2 3 4
3 4 5 4 3 5 3 4 6 3
5 6 2 5 6 5 5 7 4 5
8 5 4 9 4 5 7 3 6 8
5 6 8 6 7 10 6 6 12 4
5 10 3 7 9 6 5 8 7 8
11 6 5 12 4 8 11 5 8 10
5 6 13 9 6 11 7 7 14 6
8 13 5 8 11 7 9 13 8 9
The value of G(1000000) is 5402
</pre>
=={{header|Raku}}==
| |||
Revision as of 22:32, 7 May 2022

You are encouraged to solve this task according to the task description, using any language you may know.
| This page uses content from Wikipedia. The original article was at Goldbach's comet. The list of authors can be seen in the page history. As with Rosetta Code, the text of Wikipedia is available under the GNU FDL. (See links for details on variance) |
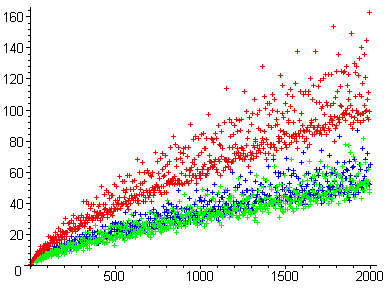
Goldbach's comet is the name given to a plot of the function g(E), the so-called Goldbach function.
The Goldbach function is studied in relation to Goldbach's conjecture. The function g(E) is defined for all even integers E>2 to be the number of different ways in which E can be expressed as the sum of two primes.
- Examples
- G(4) = 1, since 4 can only be expressed as the sum of one distinct pair of primes (4 = 2 + 2)
- G(22) = 3, since 22 can be expressed as the sum of 3 distinct pairs of primes (22 = 11 + 11 = 5 + 17 = 3 + 19)
- Task
- Find and show (preferably, in a neat 10x10 table) the first 100 G numbers (that is: the result of the G function described above, for the first 100 even numbers >= 4)
- Find and display the value of G(1000000)
- Stretch
- Calculate the values of G up to 2000 (inclusive) and display the results in a scatter 2d-chart, aka the Goldbach's Comet
- See also
ALGOL 68
Generates an ASCII-Art scatter plot - the vertical axis is n/10 and the hotizontal is G(n).
<lang algol68>BEGIN # calculate values of the Goldbach function G where G(n) is the number #
     # of prime pairs that sum to n, n even and > 2                         #
     # generates an ASCII scatter plot of G(n) up to G(2000)                #
   PR read "primes.incl.a68" PR          # include prime utilities          #
   INT max number = 1 000 000;           # maximum number we will consider  #
   # get a list of primes up to max number #
   []INT prime list = EXTRACTPRIMESUPTO max number FROMPRIMESIEVE PRIMESIEVE max number;
   [ 1 : max number ]INT g2;             # table of G values: g2[n] = G(2n) #
   # construct the table of G values #
   FOR n TO UPB g2 DO g2[ n ] := 0 OD;
   g2[ 2 ] := 1;                     # 4 is the only sum of two even primes #
   FOR n FROM 2 TO UPB prime list DO
       INT p = prime list[ n ];
       g2[ p ] +:= 1;
       FOR m FROM n + 1 TO UPB prime list
       WHILE INT sum = p + prime list[ m ];
             sum <= max number
       DO
           g2[ sum OVER 2 ] +:= 1
       OD
   OD;
   # show the first hundred G values #
   FOR n FROM 2 TO 101 DO
       print( ( whole( g2[ n ], -4 ) ) );
       IF ( n - 1 ) MOD 10 = 0 THEN print( ( newline ) ) FI
   OD;
   # G( 1 000 000 ) #
   print( ( "G(", whole( max number, 0 ), "): "
          , whole( g2[ max number OVER 2 ], 0 )
          , newline
          )
        );
   # find the maximum value of G up to the maximum plot size #
   INT max plot = 2000;
   INT max g   := 0;
   FOR n TO max plot OVER 2 DO
       IF g2[ n ] > max g THEN max g := g2[ n ] FI
   OD;
   # draw an ASCII scatter plot of G, each position represents 10 G values #
   # the vertical axis is n, the horizontal axis is G(n) #
   INT plot step = 10;
   STRING plot value = " .-+=*%$&#@";
   FOR g BY plot step TO ( max plot OVER 2 ) - plot step DO
       [ 0 : max g ]INT values;
       FOR v pos FROM LWB values TO UPB values DO values[ v pos ] := 0 OD;
       INT max v := 0;
       FOR g element FROM g TO g + ( plot step - 1 ) DO
           INT g2 value = g2[ g element ];
           values[ g2 value ] +:= 1;
           IF g2 value > max v THEN max v := g2 value FI
       OD;
       print( ( IF g MOD 100 = 1 THEN "+" ELSE "|" FI ) );
       FOR v pos FROM LWB values TO max v DO
           print( ( plot value[ values[ v pos ] + 1 ] ) )
       OD;
       print( ( newline ) )
   OD
END</lang>
- Output:
   1   1   1   2   1   2   2   2   2   3
   3   3   2   3   2   4   4   2   3   4
   3   4   5   4   3   5   3   4   6   3
   5   6   2   5   6   5   5   7   4   5
   8   5   4   9   4   5   7   3   6   8
   5   6   8   6   7  10   6   6  12   4
   5  10   3   7   9   6   5   8   7   8
  11   6   5  12   4   8  11   5   8  10
   5   6  13   9   6  11   7   7  14   6
   8  13   5   8  11   7   9  13   8   9
G(1000000): 5402
+.=*
|  +*-
|   +=-.
|  ...=-.
|   .-+....
|     .=.- . .
|   ..-.-...
|    .-. +  -.
|     .-- ... ..
|     ...+. . -
+      .+.-   ..    .
|       + + ..  .  .
|      . -+.   . -
|       -.- .  . -  .
|        + ...   .. . .
|        .--..  - .
|      .. ..- .     ..   .
|         -+  .  ..  . .
|        - .. .-   -   .
|       . ..-. .    . .     .
+          .+ -   .  ..        .
|         . -..-    . -
|         .  +-  .    .  .  .
|           ..-..       ..   ..
|         . . +.    .  .-
|           -  -- .     .   .    .
|           . .-. .    . ..    .
|          .+ .    ..   -      .
|           ..-. .  .    . .    .
|            -. -.        . . .  .
+            ....  ...     -.
|          . . .....         .  .         .
|             . ... . .   . . .           .
|           .  ....   -      .  . .
|           .  . +  .    .     -        .
|              ......    .      .     . .
|              .+  .. .       . -
|              .. ..- .         .   .   .
|               ..-.       .   ...           .
|              -. ..  ..       .   .   .
+              . -.. -           . .    .
|                ...  .-      .   ..                .
|               . .-..    .     ..      .
|              .  -.. .   .       .  .         .
|                  .-.. .          .  . .        .
|               - .. .  .       -  ..
|                 .+ -   .           .      .   .
|                  ... .. .       ..  .       .
|                .-..      ..    .  .         .
|             .   -  .  . .  .        . .            .
+                  + .  . .          .  .  .        .
|                  -  ..  ...        .   . .
|                  .+  . .  .           .    .            .
|                    ..  -. .         . ..             .
|                  - .. .  . .          ..       .
|                .     ...-        .      .  .         .
|                   .. .-  .            .       . .        .
|                  ..  . . .. .      . .   .
|                  ..  - ...                .     .        .
|                    -  .-        .      .  . .        .
+                   ....    ..   .         ..     .
|                  .   -  -  .     .       .  .         .
|                    .. -  . .               ..     .                .
|                     ..  .--            . -
|                    . ..  -  .   .            .  .          .
|                       .- ..  .               -      .            .
|                     ..  -..             .   . .     .
|                     .- .. .     .       .            .     .
|                       .   =.               .  ..            .
|                    -   +     .   .         ..             .
+                  . .  . . .  .   .            ..         .
|                      -- .         .     .        .      .  .
|                    .     ...    .. .        .  ..
|                      . ...  ..   .            .   .                     .
|                         . ... ..                 . -              .
|                       . ..-   . .                 .    .  .
|                      .   .-.   .             ...                    .
|                     .  ..  . ..              .    .          .         .
|                       . .. .. .      .        .   .     .
|                        .....     . .                     .     .      .
+                       .   .  . .  .      .    .     -           .
|                        .  - .     -    .              .    .      .
|                          .--  .       .            .  .                    .
|                            -  .  .. .               .. .                          .
|                        . . .  .. .  .              .   ..
|                     .    ..  - .     .                .            .         .
|                         .   . . . ..                . .        .           .
|                         - .  .  .       .      .   .  -
|                           ... ...   .               .               .   .
|                         . .  ..    -               .      .      .        .
+                           .-  -    .         .      -                  .
|                         . ...   ..  .                    .   .             .
|                            -.  -     .               -               .     .
|                            . . . . . .    .         .    .  .
|                            . . .- ..                        . .                           .
|                            . -    .-                  .  .       .              .
|                            . -  ..    . .                .      .  .
|                           . ...  ..            .    .    .                        .
|                          .  .  -.    .                 .     .        .          .
Arturo
<lang rebol>G: function [n][
   size select 2..n/2 'x ->
       and? [prime? x][prime? n-x]
]
print "The first 100 G values:" loop split.every: 10 map select 4..202 => even? => G 'row [
print map to [:string] row 'item -> pad item 3
]
print ["\nG(1000000) =" G 1000000]
csv: join.with:",\n" map select 4..2000 => even? 'x ->
~"|x|, |G x|"
- write the CSV data to a file which we can then visualize
- via our preferred spreadsheet app
write "comet.csv" csv</lang>
- Output:
The first 100 G values:
  1   1   1   2   1   2   2   2   2   3
  3   3   2   3   2   4   4   2   3   4
  3   4   5   4   3   5   3   4   6   3
  5   6   2   5   6   5   5   7   4   5
  8   5   4   9   4   5   7   3   6   8
  5   6   8   6   7  10   6   6  12   4
  5  10   3   7   9   6   5   8   7   8
 11   6   5  12   4   8  11   5   8  10
  5   6  13   9   6  11   7   7  14   6
  8  13   5   8  11   7   9  13   8   9

G(1000000) = 5402
Here, you can find the result of the visualization - or the "Goldbach's comet": 2D-chart of all G values up to 2000
Julia
Run in VS Code or REPL to view and save the plot. <lang ruby>using Combinatorics using Plots using Primes
g(n) = iseven(n) ? count(p -> all(isprime, p), partitions(n, 2)) : error("n must be even")
println("The first 100 G numbers are: ")
foreach(p -> print(lpad(p[2], 4), p[1] % 10 == 0 ? "\n" : ""), map(g, 4:2:202) |> enumerate)
println("\nThe value of G(1000000) is ", g(1_000_000))
x = collect(4:2:4002) y = map(g, x) scatter(x .÷ 2, y, markersize = 2, color = ["red", "blue", "green"][(x .÷ 2) .% 3 .+ 1])
</lang>
- Output:
The first 100 G numbers are:
1 1 1 2 1 2 2 2 2 3 3 3 2 3 2 4 4 2 3 4 3 4 5 4 3 5 3 4 6 3 5 6 2 5 6 5 5 7 4 5 8 5 4 9 4 5 7 3 6 8 5 6 8 6 7 10 6 6 12 4 5 10 3 7 9 6 5 8 7 8 11 6 5 12 4 8 11 5 8 10 5 6 13 9 6 11 7 7 14 6 8 13 5 8 11 7 9 13 8 9The value of G(1000000) is 5402
Python
<lang python>from matplotlib.pyplot import scatter from sympy import isprime
def prime_duo_partitions(n):
if isprime(n):
yield (n,)
for i in range(1, n//2 + 1):
if isprime(i) and isprime(n - i):
yield (i, n - i)
def g(n):
assert n > 2 and n % 2 == 0, 'n in goldbach function g(n) must be even' return len(list(prime_duo_partitions(n)))
print('The first 100 G numbers are:')
col = 1 for n in range(4, 204, 2):
print(str(g(n)).ljust(4), end = '\n' if (col % 10 == 0) else ) col += 1
print('\nThe value of G(1000000) is', g(1_000_000))
x = range(4, 4002, 2) y = [g(i) for i in x] colors = [["red", "blue", "green"][(i // 2) % 3] for i in x] scatter([i // 2 for i in x], y, marker='.', color = colors)
</lang>
- Output:
The first 100 G numbers are:

  1   1   1   2   1   2   2   2   2   3
  3   3   2   3   2   4   4   2   3   4
  3   4   5   4   3   5   3   4   6   3
  5   6   2   5   6   5   5   7   4   5
  8   5   4   9   4   5   7   3   6   8
  5   6   8   6   7  10   6   6  12   4
  5  10   3   7   9   6   5   8   7   8
 11   6   5  12   4   8  11   5   8  10
  5   6  13   9   6  11   7   7  14   6
  8  13   5   8  11   7   9  13   8   9

The value of G(1000000) is 5402
Raku
For the stretch, actually generates a plot, doesn't just calculate values to be plotted by a third party application. Deviates slightly from the stretch goal, plots the first two thousand defined values rather than the values up to two thousand that happen to be defined. (More closely matches the wikipedia example image.)
<lang perl6>sub G (Int $n) { +(2..$n/2).grep: { .is-prime && ($n - $_).is-prime } }
- Task
put "The first 100 G values:\n", (^100).map({ G 2 × $_ + 4 }).batch(10)».fmt("%2d").join: "\n";
put "\nG 1_000_000 = ", G 1_000_000;
- Stretch
use SVG; use SVG::Plot;
my @x = map 2 × * + 4, ^2000; my @y = @x.map: &G;
'Goldbachs-Comet-Raku.svg'.IO.spurt: SVG.serialize: SVG::Plot.new(
   width       => 1000,
   height      => 500,
   background  => 'white',
   title       => "Goldbach's Comet",
   x           => @x,
   values      => [@y,],
).plot: :points; </lang>
- Output:
The first 100 G values:
 1  1  1  2  1  2  2  2  2  3
 3  3  2  3  2  4  4  2  3  4
 3  4  5  4  3  5  3  4  6  3
 5  6  2  5  6  5  5  7  4  5
 8  5  4  9  4  5  7  3  6  8
 5  6  8  6  7 10  6  6 12  4
 5 10  3  7  9  6  5  8  7  8
11  6  5 12  4  8 11  5  8 10
 5  6 13  9  6 11  7  7 14  6
 8 13  5  8 11  7  9 13  8  9

G 1_000_000 = 5402
Stretch goal: (offsite SVG image) Goldbachs-Comet-Raku.svg
Wren
<lang ecmascript>import "./math" for Int import "./trait" for Stepped import "./fmt" for Fmt import "io" for File
var limit = 2000 var primes = Int.primeSieve(limit-1).skip(1).toList var goldbach = {4: 1} for (i in Stepped.new(6..limit, 2)) goldbach[i] = 0 for (i in 0...primes.count) {
   for (j in i...primes.count) {
       var s = primes[i] + primes[j]
       if (s > limit) break
       goldbach[s] = goldbach[s] + 1
   }
}
System.print("The first 100 G values:") var count = 0 for (i in Stepped.new(4..202, 2)) {
   count = count + 1
   Fmt.write("$2d ", goldbach[i])
   if (count % 10 == 0) System.print()
}
primes = Int.primeSieve(499999).skip(1) var gm = 0 for (p in primes) {
if (Int.isPrime(1e6 - p)) gm = gm + 1
} System.print("\nG(1000000) = %(gm)")
// create .csv file for values up to 2000 for display by an external plotter // the third field being the color (red = 0, blue = 1, green = 2) File.create("goldbachs_comet.csv") { |file|
   for(i in Stepped.new(4..limit, 2)) {
       file.writeBytes("%(i), %(goldbach[i]), %(i/2 % 3)\n")
   }
}</lang>
- Output:
The first 100 G values:
 1  1  1  2  1  2  2  2  2  3
 3  3  2  3  2  4  4  2  3  4
 3  4  5  4  3  5  3  4  6  3
 5  6  2  5  6  5  5  7  4  5
 8  5  4  9  4  5  7  3  6  8
 5  6  8  6  7 10  6  6 12  4
 5 10  3  7  9  6  5  8  7  8
11  6  5 12  4  8 11  5  8 10
 5  6 13  9  6 11  7  7 14  6
 8 13  5  8 11  7  9 13  8  9

G(1000000) = 5402
XPL0
<lang XPL0> func IsPrime(N); \Return 'true' if N is prime int N, I; [if N <= 2 then return N = 2; if (N&1) = 0 then \even >2\ return false; for I:= 3 to sqrt(N) do
   [if rem(N/I) = 0 then return false;
   I:= I+1;
   ];
return true; ];
int PT(1_000_000);
func G(E); \Ways E can be expressed as sum of two primes int E, C, I, J, T; [C:= 0; I:= 0; loop [J:= I;
       if PT(J) + PT(I) > E then return C;
       loop    [T:= PT(J) + PT(I);
               if T = E then C:= C+1;
               if T > E then quit;
               J:= J+1;
               ];
       I:= I+1;
       ];
];
int I, N; [I:= 0; \make prime table for N:= 2 to 1_000_000 do
       if IsPrime(N) then
               [PT(I):= N;  I:= I+1];
I:= 4; \show first 100 G numbers Format(4, 0); for N:= 1 to 100 do
       [RlOut(0, float(G(I)));
       if rem(N/10) = 0 then CrLf(0);
       I:= I+2;
       ];
CrLf(0); Text(0, "G(1,000,000) = "); IntOut(0, G(1_000_000)); CrLf(0); ]</lang>
- Output:
   1   1   1   2   1   2   2   2   2   3
   3   3   2   3   2   4   4   2   3   4
   3   4   5   4   3   5   3   4   6   3
   5   6   2   5   6   5   5   7   4   5
   8   5   4   9   4   5   7   3   6   8
   5   6   8   6   7  10   6   6  12   4
   5  10   3   7   9   6   5   8   7   8
  11   6   5  12   4   8  11   5   8  10
   5   6  13   9   6  11   7   7  14   6
   8  13   5   8  11   7   9  13   8   9

G(1,000,000) = 5402