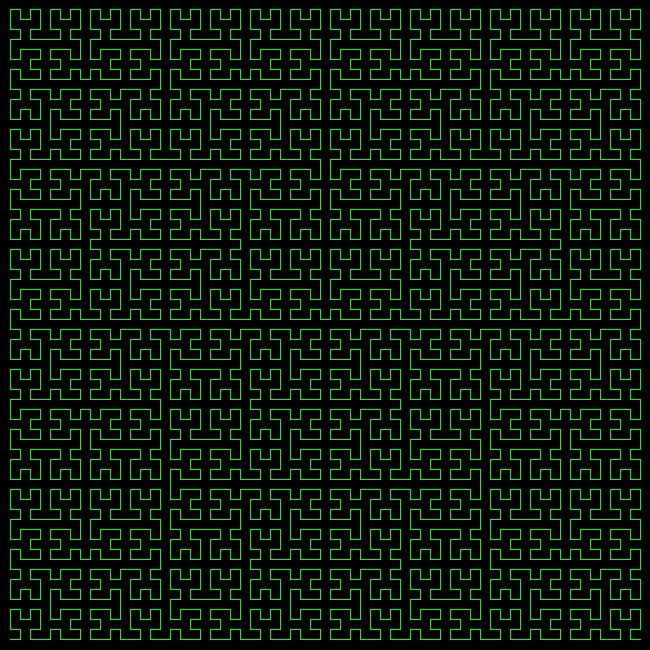
Hilbert curve
Produce a graphical or ASCII-art representation of a Hilbert curve of at least order 3.

You are encouraged to solve this task according to the task description, using any language you may know.
- Task
C
<lang c>#include <stdio.h>
- define N 32
- define K 3
- define MAX N * K
typedef struct { int x; int y; } point;
void rot(int n, point *p, int rx, int ry) {
   int t;
   if (!ry) {
       if (rx == 1) {
           p->x = n - 1 - p->x;
           p->y = n - 1 - p->y;
       }
       t = p->x;
       p->x = p->y;
       p->y = t;
   }
}
void d2pt(int n, int d, point *p) {
   int s = 1, t = d, rx, ry;
   p->x = 0;
   p->y = 0;
   while (s < n) {
       rx = 1 & (t / 2);
       ry = 1 & (t ^ rx);
       rot(s, p, rx, ry);
       p->x += s * rx;
       p->y += s * ry;
       t /= 4;
       s *= 2;
   }
}
int main() {
   int d, x, y, cx, cy, px, py;
   char pts[MAX][MAX];
   point curr, prev;
   for (x = 0; x < MAX; ++x)
       for (y = 0; y < MAX; ++y) pts[x][y] = ' ';
   prev.x = prev.y = 0;
   pts[0][0] = '.';
   for (d = 1; d < N * N; ++d) {
       d2pt(N, d, &curr);
       cx = curr.x * K;
       cy = curr.y * K;
       px = prev.x * K;
       py = prev.y * K;
       pts[cx][cy] = '.';
       if (cx == px ) {
           if (py < cy)
               for (y = py + 1; y < cy; ++y) pts[cx][y] = '|';
           else
               for (y = cy + 1; y < py; ++y) pts[cx][y] = '|';
       }
       else {
           if (px < cx)
               for (x = px + 1; x < cx; ++x) pts[x][cy] = '_';
           else
               for (x = cx + 1; x < px; ++x) pts[x][cy] = '_';
       }
       prev = curr;
   }
   for (x = 0; x < MAX; ++x) {
       for (y = 0; y < MAX; ++y) printf("%c", pts[y][x]);
       printf("\n");
   }
   return 0;
}</lang>
- Output:
Same as Kotlin entry.
Go
The following is based on the recursive algorithm and C code in this paper. The image produced is similar to the one linked to in the zkl example.
<lang go>package main
import "github.com/fogleman/gg"
var points []gg.Point
const width = 64
func hilbert(x, y, lg, i1, i2 int) {
   if lg == 1 {
       px := float64(width-x) * 10
       py := float64(width-y) * 10
       points = append(points, gg.Point{px, py})
       return
   }
   lg >>= 1
   hilbert(x+i1*lg, y+i1*lg, lg, i1, 1-i2)
   hilbert(x+i2*lg, y+(1-i2)*lg, lg, i1, i2)
   hilbert(x+(1-i1)*lg, y+(1-i1)*lg, lg, i1, i2)
   hilbert(x+(1-i2)*lg, y+i2*lg, lg, 1-i1, i2)
}
func main() {
   hilbert(0, 0, width, 0, 0)
   dc := gg.NewContext(650, 650)
   dc.SetRGB(0, 0, 0) // Black background
   dc.Clear()
   for _, p := range points {
       dc.LineTo(p.X, p.Y)
   }
   dc.SetHexColor("#90EE90") // Light green curve
   dc.SetLineWidth(1)
   dc.Stroke()
   dc.SavePNG("hilbert.png")
}</lang>
IS-BASIC
<lang IS-BASIC>100 PROGRAM "Hilbert.bas" 110 OPTION ANGLE DEGREES 120 GRAPHICS HIRES 2 130 LET N=5:LET P=1:LET S=11*2^(6-N) 140 PLOT 940,700,ANGLE 180; 150 CALL HILBERT(S,N,P) 160 DEF HILBERT(S,N,P) 170 IF N=0 THEN EXIT DEF 180 PLOT LEFT 90*P; 190 CALL HILBERT(S,N-1,-P) 200 PLOT FORWARD S;RIGHT 90*P; 210 CALL HILBERT(S,N-1,P) 220 PLOT FORWARD S; 230 CALL HILBERT(S,N-1,P) 240 PLOT RIGHT 90*P;FORWARD S; 250 CALL HILBERT(S,N-1,-P) 260 PLOT LEFT 90*P; 270 END DEF</lang>
Julia
Color graphics version using the Gtk package. <lang julia>using Gtk, Graphics, Colors
Base.isless(p1::Vec2, p2::Vec2) = (p1.x == p2.x ? p1.y < p2.y : p1.x < p2.x)
struct Line p1::Point p2::Point end line(v1::Vec2, v2::Vec2) = Line(Point(v1.x, v1.y), Point(v2.x, v2.y))
dist(p1, p2) = sqrt((p2.y - p1.y)^2 + (p2.x - p1.x)^2) length(ln::Line) = dist(ln.p1, ln.p2) ishorizontal(line) = (line.p1.y == line.p2.y)
const colorseq = [colorant"blue", colorant"red", colorant"green"] const linewidth = 1 const toporder = 3
function drawline(ctx, p1, p2, color, width)
   move_to(ctx, p1.x, p1.y)
   set_source(ctx, color)
   line_to(ctx, p2.x, p2.y)
   set_line_width(ctx, width)
   stroke(ctx)
end drawline(ctx, line, color, width=linewidth) = drawline(ctx, line.p1, line.p2, color, width)
function hilbertmutateboxes(ctx, line, order, maxorder=toporder)
   if line.p1 < line.p2
       p1, p2 = line.p1, line.p2
   else
       p2, p1 = line.p1, line.p2
   end
   color = colorseq[order % 3 + 1]
d = dist(p1, p2) / 3
   if ishorizontal(line)
       pl = Point(p1.x + d, p1.y)
       plu = Point(p1.x + d, p1.y - d)
       pld = Point(p1.x + d, p1.y + d)
       pr = Point(p2.x - d, p2.y)
       pru = Point(p2.x - d, p2.y - d)
       prd = Point(p2.x - d, p2.y + d)
       lines = [Line(plu, pl), Line(plu, pru), Line(pru, pr),
                Line(pr, prd), Line(pld, prd), Line(pld, pl)]
   else # vertical
       pu = Point(p1.x, p1.y + d)
       pul = Point(p1.x - d, p1.y + d)
       pur = Point(p1.x + d, p1.y + d)
       pd = Point(p2.x, p2.y - d)
       pdl = Point(p2.x - d, p2.y - d)
       pdr = Point(p2.x + d, p2.y - d)
       lines = [Line(pul, pu), Line(pul, pdl), Line(pdl, pd),
                Line(pu, pur), Line(pur, pdr), Line(pd, pdr)]
   end
   for li in lines
       drawline(ctx, li, color)
   end
   if order <= maxorder
       for li in lines
           hilbertmutateboxes(ctx, li, order + 1, maxorder)
       end
   end
end
const can = @GtkCanvas()
const win = GtkWindow(can, "Hilbert 2D", 400, 400)
@guarded draw(can) do widget
   ctx = getgc(can)
   h = height(can)
   w = width(can)
   line = Line(Point(0, h/2), Point(w, h/2))
   drawline(ctx, line, colorant"black", 2)
   hilbertmutateboxes(ctx, line, 0)
end
show(can)
const cond = Condition()
endit(w) = notify(cond)
signal_connect(endit, win, :destroy)
wait(cond)
</lang>
Kotlin
Terminal drawing using ASCII characters within a 96 x 96 grid - starts at top left, ends at top right.
The coordinates of the points are generated using a translation of the C code in the Wikipedia article and then scaled by a factor of 3 (n = 32). <lang scala>// Version 1.2.40
data class Point(var x: Int, var y: Int)
fun d2pt(n: Int, d: Int): Point {
   var x = 0
   var y = 0
   var t = d
   var s = 1
   while (s < n) {
       val rx = 1 and (t / 2)
       val ry = 1 and (t xor rx)
       val p = Point(x, y)
       rot(s, p, rx, ry)
       x = p.x + s * rx
       y = p.y + s * ry
       t /= 4
       s *= 2
   }
   return Point(x, y)
}
fun rot(n: Int, p: Point, rx: Int, ry: Int) {
   if (ry == 0) {
       if (rx == 1) {
           p.x = n - 1 - p.x
           p.y = n - 1 - p.y
       }
       val t  = p.x
       p.x = p.y
       p.y = t
   }
}
fun main(args:Array<String>) {
   val n = 32
   val k = 3
   val pts = List(n * k) { CharArray(n * k) { ' ' } }
   var prev = Point(0, 0)
   pts[0][0] = '.'
   for (d in 1 until n * n) {
       val curr = d2pt(n, d)
       val cx = curr.x * k
       val cy = curr.y * k
       val px = prev.x * k
       val py = prev.y * k
       pts[cx][cy] = '.'
       if (cx == px ) {
           if (py < cy)
               for (y in py + 1 until cy) pts[cx][y] = '|'
           else
               for (y in cy + 1 until py) pts[cx][y] = '|'
       }
       else {
           if (px < cx)
              for (x in px + 1 until cx) pts[x][cy] = '_'
           else
              for (x in cx + 1 until px) pts[x][cy] = '_'
       }
       prev = curr
   }
   for (i in 0 until n * k) {
       for (j in 0 until n * k) print(pts[j][i])
       println()
   }
}</lang>
- Output:
.  .__.__.  .__.__.  .__.__.  .__.__.  .__.__.  .__.__.  .__.__.  .__.__.  .__.__.  .__.__.  .
|  |     |  |     |  |     |  |     |  |     |  |     |  |     |  |     |  |     |  |     |  |
|  |     |  |     |  |     |  |     |  |     |  |     |  |     |  |     |  |     |  |     |  |
.__.  .__.  .__.  .__.  .__.  .__.  .__.  .__.  .__.  .__.  .__.  .__.  .__.  .__.  .__.  .__.
      |        |        |        |        |        |        |        |        |        |
      |        |        |        |        |        |        |        |        |        |
.__.  .__.  .__.  .__.  .  .__.  .  .__.  .__.  .__.  .__.  .  .__.  .  .__.  .__.  .__.  .__.
|  |     |  |     |  |  |  |  |  |  |  |     |  |     |  |  |  |  |  |  |  |     |  |     |  |
|  |     |  |     |  |  |  |  |  |  |  |     |  |     |  |  |  |  |  |  |  |     |  |     |  |
.  .__.__.  .__.__.  .  .__.  .__.  .  .__.__.  .__.__.  .  .__.  .__.  .  .__.__.  .__.__.  .
|                    |              |                    |              |                    |
|                    |              |                    |              |                    |
.__.  .__.__.__.  .__.  .__.  .__.  .  .__.__.  .__.__.  .  .__.  .__.  .__.  .__.__.__.  .__.
   |  |        |  |     |  |  |  |  |  |     |  |     |  |  |  |  |  |     |  |        |  |
   |  |        |  |     |  |  |  |  |  |     |  |     |  |  |  |  |  |     |  |        |  |
.__.  .__.  .__.  .__.  .  .__.  .  .__.  .__.  .__.  .__.  .  .__.  .  .__.  .__.  .__.  .__.
|        |  |        |  |        |        |        |        |        |  |        |  |        |
|        |  |        |  |        |        |        |        |        |  |        |  |        |
.  .__.  .  .  .__.  .  .__.  .__.  .__.  .__.  .__.  .__.  .__.  .__.  .  .__.  .  .  .__.  .
|  |  |  |  |  |  |  |     |  |     |  |     |  |     |  |     |  |     |  |  |  |  |  |  |  |
|  |  |  |  |  |  |  |     |  |     |  |     |  |     |  |     |  |     |  |  |  |  |  |  |  |
.__.  .__.  .__.  .__.  .__.  .__.__.  .__.__.  .__.__.  .__.__.  .__.  .__.  .__.  .__.  .__.
                        |                                            |
                        |                                            |
.__.  .__.  .__.  .__.  .__.  .__.__.  .__.__.  .__.__.  .__.__.  .__.  .__.  .__.  .__.  .__.
|  |  |  |  |  |  |  |     |  |     |  |     |  |     |  |     |  |     |  |  |  |  |  |  |  |
|  |  |  |  |  |  |  |     |  |     |  |     |  |     |  |     |  |     |  |  |  |  |  |  |  |
.  .__.  .  .  .__.  .  .__.  .__.  .__.  .__.  .__.  .__.  .__.  .__.  .  .__.  .  .  .__.  .
|        |  |        |  |        |        |        |        |        |  |        |  |        |
|        |  |        |  |        |        |        |        |        |  |        |  |        |
.__.  .__.  .__.  .__.  .  .__.  .  .__.  .__.  .__.  .__.  .  .__.  .  .__.  .__.  .__.  .__.
   |  |        |  |     |  |  |  |  |  |     |  |     |  |  |  |  |  |     |  |        |  |
   |  |        |  |     |  |  |  |  |  |     |  |     |  |  |  |  |  |     |  |        |  |
.__.  .__.__.__.  .__.  .__.  .__.  .  .__.__.  .__.__.  .  .__.  .__.  .__.  .__.__.__.  .__.
|                    |              |                    |              |                    |
|                    |              |                    |              |                    |
.  .__.__.  .__.__.  .  .__.  .__.  .  .__.__.  .__.__.  .  .__.  .__.  .  .__.__.  .__.__.  .
|  |     |  |     |  |  |  |  |  |  |  |     |  |     |  |  |  |  |  |  |  |     |  |     |  |
|  |     |  |     |  |  |  |  |  |  |  |     |  |     |  |  |  |  |  |  |  |     |  |     |  |
.__.  .__.  .__.  .__.  .  .__.  .  .__.  .__.  .__.  .__.  .  .__.  .  .__.  .__.  .__.  .__.
      |        |        |        |        |        |        |        |        |        |
      |        |        |        |        |        |        |        |        |        |
.__.  .__.  .__.  .__.  .__.  .__.  .__.  .__.  .__.  .__.  .__.  .__.  .__.  .__.  .__.  .__.
|  |     |  |     |  |     |  |     |  |     |  |     |  |     |  |     |  |     |  |     |  |
|  |     |  |     |  |     |  |     |  |     |  |     |  |     |  |     |  |     |  |     |  |
.  .__.__.  .__.__.  .__.__.  .__.__.  .__.__.  .__.__.  .__.__.  .__.__.  .__.__.  .__.__.  .
|                                                                                            |
|                                                                                            |
.__.  .__.__.  .__.__.  .__.__.  .__.__.  .__.__.__.  .__.__.  .__.__.  .__.__.  .__.__.  .__.
   |  |     |  |     |  |     |  |     |  |        |  |     |  |     |  |     |  |     |  |
   |  |     |  |     |  |     |  |     |  |        |  |     |  |     |  |     |  |     |  |
.__.  .__.  .__.  .__.  .__.  .__.  .__.  .__.  .__.  .__.  .__.  .__.  .__.  .__.  .__.  .__.
|        |        |        |        |        |  |        |        |        |        |        |
|        |        |        |        |        |  |        |        |        |        |        |
.  .__.  .  .__.  .__.  .__.  .__.  .  .__.  .  .  .__.  .  .__.  .__.  .__.  .__.  .  .__.  .
|  |  |  |  |  |     |  |     |  |  |  |  |  |  |  |  |  |  |  |     |  |     |  |  |  |  |  |
|  |  |  |  |  |     |  |     |  |  |  |  |  |  |  |  |  |  |  |     |  |     |  |  |  |  |  |
.__.  .__.  .  .__.__.  .__.__.  .  .__.  .__.  .__.  .__.  .  .__.__.  .__.__.  .  .__.  .__.
            |                    |                          |                    |
            |                    |                          |                    |
.__.  .__.  .  .__.__.  .__.__.  .  .__.  .__.  .__.  .__.  .  .__.__.  .__.__.  .  .__.  .__.
|  |  |  |  |  |     |  |     |  |  |  |  |  |  |  |  |  |  |  |     |  |     |  |  |  |  |  |
|  |  |  |  |  |     |  |     |  |  |  |  |  |  |  |  |  |  |  |     |  |     |  |  |  |  |  |
.  .__.  .  .__.  .__.  .__.  .__.  .  .__.  .  .  .__.  .  .__.  .__.  .__.  .__.  .  .__.  .
|        |        |        |        |        |  |        |        |        |        |        |
|        |        |        |        |        |  |        |        |        |        |        |
.__.  .__.  .__.  .__.  .__.  .__.  .__.  .__.  .__.  .__.  .__.  .__.  .__.  .__.  .__.  .__.
   |  |     |  |     |  |     |  |     |  |        |  |     |  |     |  |     |  |     |  |
   |  |     |  |     |  |     |  |     |  |        |  |     |  |     |  |     |  |     |  |
.__.  .__.__.  .__.__.  .__.__.  .__.__.  .__.  .__.  .__.__.  .__.__.  .__.__.  .__.__.  .__.
|                                            |  |                                            |
|                                            |  |                                            |
.  .__.__.  .__.__.  .__.  .__.__.  .__.__.  .  .  .__.__.  .__.__.  .__.  .__.__.  .__.__.  .
|  |     |  |     |  |  |  |     |  |     |  |  |  |     |  |     |  |  |  |     |  |     |  |
|  |     |  |     |  |  |  |     |  |     |  |  |  |     |  |     |  |  |  |     |  |     |  |
.__.  .__.  .__.  .__.  .__.  .__.  .__.  .__.  .__.  .__.  .__.  .__.  .__.  .__.  .__.  .__.
      |        |              |        |              |        |              |        |
      |        |              |        |              |        |              |        |
.__.  .__.  .__.  .__.  .__.  .__.  .__.  .__.  .__.  .__.  .__.  .__.  .__.  .__.  .__.  .__.
|  |     |  |     |  |  |  |     |  |     |  |  |  |     |  |     |  |  |  |     |  |     |  |
|  |     |  |     |  |  |  |     |  |     |  |  |  |     |  |     |  |  |  |     |  |     |  |
.  .__.__.  .__.__.  .  .  .__.__.  .__.__.  .  .  .__.__.  .__.__.  .  .  .__.__.  .__.__.  .
|                    |  |                    |  |                    |  |                    |
|                    |  |                    |  |                    |  |                    |
.__.  .__.__.__.  .__.  .__.  .__.__.__.  .__.  .__.  .__.__.__.  .__.  .__.  .__.__.__.  .__.
   |  |        |  |        |  |        |  |        |  |        |  |        |  |        |  |
   |  |        |  |        |  |        |  |        |  |        |  |        |  |        |  |
.__.  .__.  .__.  .__.  .__.  .__.  .__.  .__.  .__.  .__.  .__.  .__.  .__.  .__.  .__.  .__.
|        |  |        |  |        |  |        |  |        |  |        |  |        |  |        |
|        |  |        |  |        |  |        |  |        |  |        |  |        |  |        |
.  .__.  .  .  .__.  .  .  .__.  .  .  .__.  .  .  .__.  .  .  .__.  .  .  .__.  .  .  .__.  .
|  |  |  |  |  |  |  |  |  |  |  |  |  |  |  |  |  |  |  |  |  |  |  |  |  |  |  |  |  |  |  |
|  |  |  |  |  |  |  |  |  |  |  |  |  |  |  |  |  |  |  |  |  |  |  |  |  |  |  |  |  |  |  |
.__.  .__.  .__.  .__.  .__.  .__.  .__.  .__.  .__.  .__.  .__.  .__.  .__.  .__.  .__.  .__.
Perl
<lang perl>use SVG; use List::Util qw(max min);
use constant pi => 2 * atan2(1, 0);
- Compute the curve with a Lindemayer-system
%rules = (
   A => '-BF+AFA+FB-',
   B => '+AF-BFB-FA+'
); $hilbert = 'A'; $hilbert =~ s/([AB])/$rules{$1}/eg for 1..6;
- Draw the curve in SVG
($x, $y) = (0, 0); $theta = pi/2; $r = 5;
for (split //, $hilbert) {
   if (/F/) {
       push @X, sprintf "%.0f", $x;
       push @Y, sprintf "%.0f", $y;
       $x += $r * cos($theta);
       $y += $r * sin($theta);
   }
   elsif (/\+/) { $theta += pi/2; }
   elsif (/\-/) { $theta -= pi/2; }
}
$max = max(@X,@Y); $xt = -min(@X)+10; $yt = -min(@Y)+10; $svg = SVG->new(width=>$max+20, height=>$max+20); $points = $svg->get_path(x=>\@X, y=>\@Y, -type=>'polyline'); $svg->rect(width=>"100%", height=>"100%", style=>{'fill'=>'black'}); $svg->polyline(%$points, style=>{'stroke'=>'orange', 'stroke-width'=>1}, transform=>"translate($xt,$yt)");
open $fh, '>', 'hilbert_curve.svg'; print $fh $svg->xmlify(-namespace=>'svg'); close $fh;</lang> Hilbert curve (offsite image)
Perl 6
<lang perl6>use SVG;
role Lindenmayer {
   has %.rules;
   method succ {
       self.comb.map( { %!rules{$^c} // $c } ).join but Lindenmayer(%!rules)
   }
}
my $hilbert = 'A' but Lindenmayer( { A => '-BF+AFA+FB-', B => '+AF-BFB-FA+' } );
$hilbert++ xx 7; my @points = (647, 13);
for $hilbert.comb {
   state ($x, $y) = @points[0,1];
   state $d = -5 - 0i;
   when 'F' { @points.append: ($x += $d.re).round(1), ($y += $d.im).round(1) }
   when /< + - >/ { $d *= "{$_}1i" }
   default { }
}
say SVG.serialize(
   svg => [
       :660width, :660height, :style<stroke:blue>,
       :rect[:width<100%>, :height<100%>, :fill<white>],
       :polyline[ :points(@points.join: ','), :fill<white> ],
   ],
);</lang> See: Hilbert curve
There is a variation of a Hilbert curve known as a Moore curve which is essentially 4 Hilbert curves joined together in a loop. <lang perl6>use SVG;
role Lindenmayer {
   has %.rules;
   method succ {
       self.comb.map( { %!rules{$^c} // $c } ).join but Lindenmayer(%!rules)
   }
}
my $moore = 'AFA+F+AFA' but Lindenmayer( { A => '-BF+AFA+FB-', B => '+AF-BFB-FA+' } );
$moore++ xx 6; my @points = (327, 647);
for $moore.comb {
   state ($x, $y) = @points[0,1];
   state $d = 0 - 5i;
   when 'F' { @points.append: ($x += $d.re).round(1), ($y += $d.im).round(1) }
   when /< + - >/ { $d *= "{$_}1i" }
   default { }
}
say SVG.serialize(
   svg => [
       :660width, :660height, :style<stroke:darkviolet>,
       :rect[:width<100%>, :height<100%>, :fill<white>],
       :polyline[ :points(@points.join: ','), :fill<white> ],
   ],
);</lang> See: Moore curve
Ring
<lang ring>
- Project : Hilbert curve
load "guilib.ring"
paint = null x1 = 0 y1 = 0
new qapp
       {
       win1 = new qwidget() {
                 setwindowtitle("Hilbert curve")
                 setgeometry(100,100,400,500)
                 label1 = new qlabel(win1) {
                             setgeometry(10,10,400,400)
                             settext("")
                 }
                 new qpushbutton(win1) {
                         setgeometry(150,400,100,30)
                         settext("draw")
                         setclickevent("draw()")
                 }
                 show()
       }
       exec()
       }
func draw
       p1 = new qpicture()
              color = new qcolor() {
              setrgb(0,0,255,255)
       }
       pen = new qpen() {
                setcolor(color)
                setwidth(1)
       }
       paint = new qpainter() {
                 begin(p1)
                 setpen(pen)
       x1 = 0.5
       y1 = 0.5
       hilbert(0, 0, 200,  0,  0,  200,  4)
       endpaint()
       }
       label1 { setpicture(p1) show() }
func hilbert (x, y, xi, xj, yi, yj, n)
       cur = new QCursor() {
                setpos(100, 100)
       }
       if (n <= 0)
          drawtoline(x + (xi + yi)/2, y + (xj + yj)/2)
      else
          hilbert(x, y, yi/2, yj/2, xi/2, xj/2, n-1)
          hilbert(x+xi/2, y+xj/2 , xi/2, xj/2, yi/2, yj/2, n-1)
          hilbert(x+xi/2+yi/2, y+xj/2+yj/2, xi/2, xj/2, yi/2, yj/2, n-1);
          hilbert(x+xi/2+yi, y+xj/2+yj, -yi/2,-yj/2, -xi/2, -xj/2, n-1)
      ok
func drawtoline x2, y2
       paint.drawline(x1, y1, x2, y2)
       x1 = x2
       y1 = y2
</lang> Output image: Hilbert curve
Scala
Scala.js
<lang Scala>@js.annotation.JSExportTopLevel("ScalaFiddle") object ScalaFiddle {
 // $FiddleStart
 import scala.util.Random
case class Point(x: Int, y: Int)
 def xy2d(order: Int, d: Int): Point = {
   def rot(order: Int, p: Point, rx: Int, ry: Int): Point = {
     val np = if (rx == 1) Point(order - 1 - p.x, order - 1 - p.y) else p
     if (ry == 0) Point(np.y, np.x) else p
   }
   @scala.annotation.tailrec
   def iter(rx: Int, ry: Int, s: Int, t: Int, p: Point): Point = {
     if (s < order) {
       val _rx = 1 & (t / 2)
       val _ry = 1 & (t ^ _rx)
       val temp = rot(s, p, _rx, _ry)
       iter(_rx, _ry, s * 2, t / 4, Point(temp.x + s * _rx, temp.y + s * _ry))
     } else p
   }
   iter(0, 0, 1, d, Point(0, 0))
 }
 def randomColor =
   s"rgb(${Random.nextInt(240)}, ${Random.nextInt(240)}, ${Random.nextInt(240)})"
 val order = 64
 val factor = math.min(Fiddle.canvas.height, Fiddle.canvas.width) / order.toDouble
 val maxD = order * order
 var d = 0
 Fiddle.draw.strokeStyle = randomColor
 Fiddle.draw.lineWidth = 2
 Fiddle.draw.lineCap = "square"
 Fiddle.schedule(10) {
   val h = xy2d(order, d)
   Fiddle.draw.lineTo(h.x * factor, h.y * factor)
   Fiddle.draw.stroke
   if ({d += 1; d >= maxD})
   {d = 1; Fiddle.draw.strokeStyle = randomColor}
   Fiddle.draw.beginPath
   Fiddle.draw.moveTo(h.x * factor, h.y * factor)
 }
 // $FiddleEnd
}</lang>
- Output:
Best seen running in your browser by ScalaFiddle (ES aka JavaScript, non JVM).
Sidef
<lang ruby>require('Image::Magick')
class Turtle(
   x      = 500,
   y      = 500,
   angle  = 0,
   scale  = 1,
   mirror = 1,
   xoff   = 0,
   yoff   = 0,
   color  = 'black',
) {
has im = %O<Image::Magick>.new(size => "#{x}x#{y}")
   method init {
       angle.deg2rad!
       im.ReadImage('canvas:white')
   }
   method forward(r) {
       var (newx, newy) = (x + r*sin(angle), y + r*-cos(angle))
       im.Draw(
           primitive => 'line',
           points    => join(' ',
                          int(x    * scale + xoff),
                          int(y    * scale + yoff),
                          int(newx * scale + xoff),
                          int(newy * scale + yoff),
                       ),
           stroke      => color,
           strokewidth => 1,
       )
       (x, y) = (newx, newy)
   }
   method save_as(filename) {
       im.Write(filename)
   }
   method turn(theta) {
       angle += theta*mirror
   }
   method state {
       [x, y, angle, mirror]
   }
   method setstate(state) {
       (x, y, angle, mirror) = state...
   }
   method mirror {
       mirror.neg!
   }
}
class LSystem(
   angle  = 90,
   scale  = 1,
   xoff   = 0,
   yoff   = 0,
   len    = 5,
   color  = 'black',
   width  = 500,
   height = 500,
   turn   = 0,
) {
   has stack = []
   has table = Hash()
   has turtle = Turtle(
       x:     width,
       y:     height,
       angle: turn,
       scale: scale,
       color: color,
       xoff:  xoff,
       yoff:  yoff,
   )
method init {
       angle.deg2rad!
       turn.deg2rad!
       table = Hash(
           '+' => { turtle.turn(angle) },
           '-' => { turtle.turn(-angle) },
           ':' => { turtle.mirror },
           '[' => { stack.push(turtle.state) },
           ']' => { turtle.setstate(stack.pop) },
       )
   }
method execute(string, repetitions, filename, rules) {
       repetitions.times {
           string.gsub!(/(.)/, {|c| rules{c} \\ c })
       }
       string.each_char { |c|
           if (table.contains(c)) {
               table{c}.run
           }
           elsif (c.contains(/^upper:\z/)) {
               turtle.forward(len)
           }
       }
       turtle.save_as(filename)
   }
}
var rules = Hash(
   a => '-bF+aFa+Fb-',
   b => '+aF-bFb-Fa+',
)
var lsys = LSystem(
   width:  600,
   height: 600,
   xoff: -50,
   yoff: -50,
   len:   8,
   angle: 90,
   color: 'dark green',
)
lsys.execute('a', 6, "hilbert_curve.png", rules)</lang>
- Output:
zkl
Uses Image Magick and the PPM class from http://rosettacode.org/wiki/Bitmap/Bresenham%27s_line_algorithm#zkl <lang zkl>hilbert(6) : turtle(_);
fcn hilbert(n){ // Lindenmayer system --> Data of As & Bs
  var [const] A="-BF+AFA+FB-", B="+AF-BFB-FA+";
  buf1,buf2 := Data(Void,"A").howza(3), Data().howza(3);  // characters
  do(n){
     buf1.pump(buf2.clear(),fcn(c){ if(c=="A") A else if(c=="B") B else c });
     t:=buf1; buf1=buf2; buf2=t;	// swap buffers
  }
  buf1		// n=6 --> 13,651 letters
}
fcn turtle(hilbert){
  const D=10;
  ds,dir := T( T(D,0), T(0,-D), T(-D,0), T(0,D) ), 0;  // turtle offsets
  dx,dy := ds[dir];
  img:=PPM(650,650); x,y:=10,10; color:=0x00ff00;
  hilbert.replace("A","").replace("B","");  // A & B are no-op during drawing
  foreach c in (hilbert){
     switch(c){
case("F"){ img.line(x,y, (x+=dx),(y+=dy), color) } // draw forward case("+"){ dir=(dir+1)%4; dx,dy = ds[dir] } // turn right 90* case("-"){ dir=(dir-1)%4; dx,dy = ds[dir] } // turn left 90*
     }
  }
  img.writeJPGFile("hilbert.zkl.jpg");
}</lang> Image at hilbert curve