
Yellowstone sequence: Difference between revisions
No edit summary |
SqrtNegInf (talk | contribs) (Added Perl example) |
||
| Line 189: | Line 189: | ||
[1, 2, 3, 4, 9, 8, 15, 14, 5, 6, 25, 12, 35, 16, 7, 10, 21, 20, 27, 22, 39, 11, 13, 33, 26, 45, 28, 51, 32, 17] |
[1, 2, 3, 4, 9, 8, 15, 14, 5, 6, 25, 12, 35, 16, 7, 10, 21, 20, 27, 22, 39, 11, 13, 33, 26, 45, 28, 51, 32, 17] |
||
</pre> |
</pre> |
||
=={{header|Perl}}== |
|||
<lang perl>use strict; |
|||
use warnings; |
|||
use feature 'say'; |
|||
use List::Util qw(first); |
|||
use GD::Graph::bars; |
|||
use constant Inf => 1e5; |
|||
sub gcd { |
|||
my ($u, $v) = @_; |
|||
while ($v) { |
|||
($u, $v) = ($v, $u % $v); |
|||
} |
|||
return abs($u); |
|||
} |
|||
sub yellowstone { |
|||
my($terms) = @_; |
|||
my @s = (1, 2, 3); |
|||
my @used = (1) x 4; |
|||
my $min = 3; |
|||
while (1) { |
|||
my $index = first { not defined $used[$_] and gcd($_,$s[-2]) != 1 and gcd($_,$s[-1]) == 1 } $min .. Inf; |
|||
$used[$index] = 1; |
|||
$min = (first { not defined $used[$_] } 0..@used-1) || @used-1; |
|||
push @s, $index; |
|||
last if @s == $terms; |
|||
} |
|||
@s; |
|||
} |
|||
say "The first 30 terms in the Yellowstone sequence:\n" . join ' ', yellowstone(30); |
|||
my @data = ( [1..500], [yellowstone(500)]); |
|||
my $graph = GD::Graph::bars->new(800, 600); |
|||
$graph->set( |
|||
title => 'Yellowstone sequence', |
|||
y_max_value => 1400, |
|||
x_tick_number => 5, |
|||
r_margin => 10, |
|||
dclrs => [ 'blue' ], |
|||
) or die $graph->error; |
|||
my $gd = $graph->plot(\@data) or die $graph->error; |
|||
open(OUT, ">run/yellowstone-sequence.png"); |
|||
binmode OUT; |
|||
print OUT $gd->png(); |
|||
close(OUT); |
|||
</lang> |
|||
{{out}} |
|||
<pre>The first 30 terms in the Yellowstone sequence: |
|||
1 2 3 4 9 8 15 14 5 6 25 12 35 16 7 10 21 20 27 22 39 11 13 33 26 45 28 51 32 17</pre> |
|||
See graph at [https://github.com/SqrtNegInf/Rosettacode-Perl5-Smoke/blob/master/ref/yellowstone-sequence.png off-site PNG image] |
|||
=={{header|Perl 6}}== |
=={{header|Perl 6}}== |
||
Revision as of 01:49, 21 February 2020
The Yellowstone sequence, also called the Yellowstone permutation, is defined as:
For n <= 3,
a(n) = n.
For n >= 4,
a(n) = the smallest number not already in sequence such that a(n) is relatively prime to a(n-1) and is not relatively prime to a(n-2).
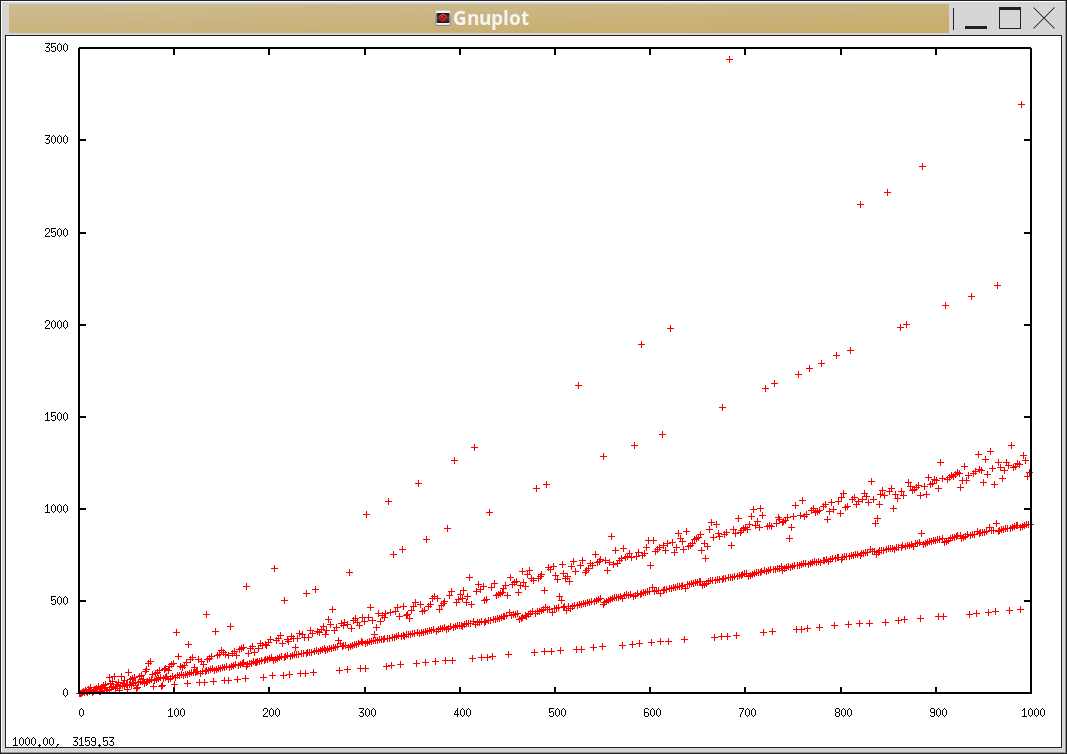
The sequence is a permutation of the natural numbers, and gets its name from what its authors felt was a spiking, geyser like appearance of a plot of the sequence.
- Example
a(4) is 4 because 4 is the smallest number following 1, 2, 3 in the sequence that is relatively prime to the entry before it (3), and is not relatively prime to the number two entries before it (2).
- Task
- Find and show as output the first 30 Yellowstone numbers.
- Extra
- Demonstrate how to plot, with x = n and y coordinate a(n), the first 100 Yellowstone numbers.
- Related tasks
- See also
-
- The OEIS entry: A098550 The Yellowstone permutation.
- Applegate et al, 2015: The Yellowstone Permutation [1].
Factor
<lang factor>USING: accessors assocs colors.constants combinators.short-circuit io kernel math prettyprint sequences sets ui ui.gadgets ui.gadgets.charts ui.gadgets.charts.lines ;
- yellowstone? ( n hs seq -- ? )
   {
       [ drop in? not ]
       [ nip last gcd nip 1 = ]
       [ nip dup length 2 - swap nth gcd nip 1 > ]
   } 3&& ;
- next-yellowstone ( hs seq -- n )
   [ 4 ] 2dip [ 3dup yellowstone? ] [ [ 1 + ] 2dip ] until
   2drop ;
- next ( hs seq -- hs' seq' )
2dup next-yellowstone [ suffix! ] [ pick adjoin ] bi ;
- <yellowstone> ( n -- seq )
   [ HS{ 1 2 3 } clone dup V{ } set-like ] dip dup 3 <=
   [ head nip ] [ 3 - [ next ] times nip ] if ;
! Show first 30 Yellowstone numbers.
"First 30 Yellowstone numbers:" print 30 <yellowstone> [ pprint bl ] each nl
! Plot first 100 Yellowstone numbers.
chart new { { 0 100 } { 0 175 } } >>axes line new COLOR: blue >>color 100 <iota> 100 <yellowstone> zip >>data add-gadget "Yellowstone numbers" open-window</lang>
- Output:
First 30 Yellowstone numbers:
1 2 3 4 9 8 15 14 5 6 25 12 35 16 7 10 21 20 27 22 39 11 13 33 26 45 28 51 32 17
Go
This uses Gnuplot-X11 to do the plotting rather than a third party Go plotting library. <lang go>package main
import (
   "fmt"
   "log"
   "os/exec"
)
func gcd(x, y int) int {
   for y != 0 {
       x, y = y, x%y
   }
   return x
}
func yellowstone(n int) []int {
   m := make(map[int]bool)
   a := make([]int, n+1)
   for i := 1; i < 4; i++ {
       a[i] = i
       m[i] = true
   }
   min := 4
   for c := 4; c <= n; c++ {
       for i := min; ; i++ {
           if !m[i] && gcd(a[c-1], i) == 1 && gcd(a[c-2], i) > 1 {
               a[c] = i
               m[i] = true
               if i == min {
                   min++
               }
               break
           }
       }
   }
   return a[1:]
}
func check(err error) {
   if err != nil {
       log.Fatal(err)
   }
}
func main() {
   x := make([]int, 100)
   for i := 0; i < 100; i++ {
       x[i] = i + 1
   }
   y := yellowstone(100)
   fmt.Println("The first 30 Yellowstone numbers are:")
   fmt.Println(y[:30])
   g := exec.Command("gnuplot", "-persist")
   w, err := g.StdinPipe()
   check(err)
   check(g.Start())
   fmt.Fprintln(w, "unset key; plot '-'")
   for i, xi := range x {
       fmt.Fprintf(w, "%d %d\n", xi, y[i])
   }
   fmt.Fprintln(w, "e")
   w.Close()
   g.Wait()
}</lang>
- Output:
The first 30 Yellowstone numbers are:
[1 2 3 4 9 8 15 14 5 6 25 12 35 16 7 10 21 20 27 22 39 11 13 33 26 45 28 51 32 17]
Julia
<lang julia>using Plots
function yellowstone(N)
   a = [1, 2, 3]
   b = Dict(1 => 1, 2 => 1, 3 => 1)
   start = 4
   while length(a) < N
       inseries = true
       for i in start:typemax(Int)
           if haskey(b, i)
               if inseries
                   start += 1
               end
           else
               inseries = false
           end
           if !haskey(b, i) && (gcd(i, a[end]) == 1) && (gcd(i, a[end - 1]) > 1)
               push!(a, i)
               b[i] = 1
               break
           end
       end
   end
   return a
end
println("The first 30 entries of the Yellowstone permutation:\n", yellowstone(30))
x = 1:100 y = yellowstone(100) plot(x, y)
</lang>
- Output:
The first 30 entries of the Yellowstone permutation:
[1, 2, 3, 4, 9, 8, 15, 14, 5, 6, 25, 12, 35, 16, 7, 10, 21, 20, 27, 22, 39, 11, 13, 33, 26, 45, 28, 51, 32, 17]
Perl
<lang perl>use strict; use warnings; use feature 'say';
use List::Util qw(first); use GD::Graph::bars;
use constant Inf => 1e5;
sub gcd {
 my ($u, $v) = @_;
 while ($v) {
   ($u, $v) = ($v, $u % $v);
 }
 return abs($u);
}
sub yellowstone {
   my($terms) = @_;
   my @s = (1, 2, 3);
   my @used = (1) x 4;
   my $min  = 3;
   while (1) {
       my $index = first { not defined $used[$_] and gcd($_,$s[-2]) != 1 and gcd($_,$s[-1]) == 1 } $min .. Inf;
       $used[$index] = 1;
       $min = (first { not defined $used[$_] } 0..@used-1) || @used-1;
       push @s, $index;
       last if @s == $terms;
   }
   @s;
}
say "The first 30 terms in the Yellowstone sequence:\n" . join ' ', yellowstone(30);
my @data = ( [1..500], [yellowstone(500)]); my $graph = GD::Graph::bars->new(800, 600); $graph->set(
   title          => 'Yellowstone sequence',
   y_max_value    => 1400,
   x_tick_number  => 5,
   r_margin       => 10,
   dclrs          => [ 'blue' ],
) or die $graph->error; my $gd = $graph->plot(\@data) or die $graph->error;
open(OUT, ">run/yellowstone-sequence.png"); binmode OUT; print OUT $gd->png(); close(OUT); </lang>
- Output:
The first 30 terms in the Yellowstone sequence:
1 2 3 4 9 8 15 14 5 6 25 12 35 16 7 10 21 20 27 22 39 11 13 33 26 45 28 51 32 17
See graph at off-site PNG image
Perl 6
Not really clear whether a line graph or bar graph was desired, so generate both. Also, 100 points don't really give a good feel for the overall shape so do 500.
<lang perl6>my @yellowstone = 1, 2, 3, -> $q, $p {
   state @used = True xx 4;
   state $min  = 3;
   my \index = ($min .. *).first: { not @used[$_] and $_ gcd $q != 1 and $_ gcd $p == 1 };
   @used[index] = True;
   $min = @used.first(!*, :k) // +@used - 1;
   index
} … *;
put "The first 30 terms in the Yellowstone sequence:\n", @yellowstone[^30];
use SVG; use SVG::Plot;
my @x = ^500;
my $chart = SVG::Plot.new(
   background  => 'white',
   width       => 1000,
   height      => 600,
   plot-width  => 950,
   plot-height => 550,
   x           => @x,
   x-tick-step => { 10 },
   y-tick-step => { 50 },
   min-y-axis  => 0,
   values      => [@yellowstone[@x],],
   title       => "Yellowstone Sequence - First {+@x} values (zero indexed)",
);
my $line = './Yellowstone-sequence-line-perl6.svg'.IO; my $bars = './Yellowstone-sequence-bars-perl6.svg'.IO;
$line.spurt: SVG.serialize: $chart.plot: :lines; $bars.spurt: SVG.serialize: $chart.plot: :bars;</lang>
- Output:
The first 30 terms in the Yellowstone sequence:
1 2 3 4 9 8 15 14 5 6 25 12 35 16 7 10 21 20 27 22 39 11 13 33 26 45 28 51 32 17
See (offsite SVG images) Line graph or Bar graph
Phix
<lang Phix>function yellowstone(integer N)
   sequence a = {1, 2, 3},
            b = repeat(true,3)
   integer i = 4
   while length(a) < N do
       if (i>length(b) or b[i]=false)
       and gcd(i,a[$])=1
       and gcd(i,a[$-1])>1 then
           a &= i
           if i>length(b) then
               b &= repeat(false,i-length(b))
           end if
           b[i] = true
           i = 4
       end if
       i += 1
   end while
   return a
end function
printf(1,"The first 30 entries of the Yellowstone permutation:\n%v\n", {yellowstone(30)})</lang>
- Output:
The first 30 entries of the Yellowstone permutation:
{1,2,3,4,9,8,15,14,5,6,25,12,35,16,7,10,21,20,27,22,39,11,13,33,26,45,28,51,32,17}
a simple plot
<lang Phix>include pGUI.e IupOpen() IupControlsOpen() Ihandle plot = IupPlot("MENUITEMPROPERTIES=Yes, SIZE=640x320") IupSetAttribute(plot, "TITLE", "Yellowstone Numbers"); IupSetAttribute(plot, "TITLEFONTSIZE", "10"); IupSetAttribute(plot, "TITLEFONTSTYLE", "ITALIC"); IupSetAttribute(plot, "GRIDLINESTYLE", "DOTTED"); IupSetAttribute(plot, "GRID", "YES"); IupSetAttribute(plot, "AXS_XLABEL", "n"); IupSetAttribute(plot, "AXS_YLABEL", "a(n)"); IupSetAttribute(plot, "AXS_XFONTSTYLE", "ITALIC"); IupSetAttribute(plot, "AXS_YFONTSTYLE", "ITALIC"); IupSetAttribute(plot, "AXS_YTICKSIZEAUTO", "NO"); IupSetAttribute(plot, "AXS_YTICKMAJORSIZE", "8"); IupSetAttribute(plot, "AXS_YTICKMINORSIZE", "0"); IupPlotBegin(plot) sequence y100 = yellowstone(100) for x=1 to 100 do
IupPlotAdd(plot, x, y100[x])
end for {} = IupPlotEnd(plot) Ihandle dlg = IupDialog(plot) IupCloseOnEscape(dlg) IupSetAttribute(dlg, "TITLE", "Yellowstone Names") IupMap(dlg) IupShowXY(dlg,IUP_CENTER,IUP_CENTER) IupMainLoop() IupClose()</lang>
REXX
<lang rexx>/*REXX program calculates any number of terms in the Yellowstone (permutation) sequence.*/ parse arg m . /*obtain optional argument from the CL.*/ if m== | m=="," then m= 30 /*Not specified? Then use the default.*/ !.= 0 /*initialize an array of numbers(used).*/
- = 0 /*count of Yellowstone numbers in seq. */
$= /*list " " " " " */
     do j=1  until #==m;  prev= # - 1
     if j<5  then do;  #= #+1;   @.#= j;  !.#= j;  !.j= 1;  $= strip($ j);  iterate;  end
        do k=1;   if !.k  then iterate          /*Already used?  Then skip this number.*/
        if gcd(k, @.#)\==1  |  gcd(k, @.prev)<2  then iterate   /*not meet requirement?*/
        #= #+1;   @.#= k;     !.k= 1;   $= $ k  /*bump ctr; assign; mark used; add list*/
        leave                                   /*find the next Yellowstone seq. number*/
        end   /*k*/
     end      /*j*/
say $ /*display a list of a Yellowstone seq. */ exit /*stick a fork in it, we're all done. */ /*──────────────────────────────────────────────────────────────────────────────────────*/ gcd: parse arg x,y; do until y==0; parse value x//y y with y x; end; return x</lang>
- output when using the default input:
1 2 3 4 9 8 15 14 5 6 25 12 35 16 7 10 21 20 27 22 39 11 13 33 26 45 28 51 32 17
zkl
This sequence is limited to the max size of a Dictionary, 64k <lang zkl>fcn yellowstoneW{ // --> iterator
  Walker.zero().tweak(fcn(a,b){
     foreach i in ([1..]){
        if(not b.holds(i) and i.gcd(a[-1])==1 and i.gcd(a[-2]) >1){
a.del(0).append(i); // only keep last two terms b[i]=True; return(i); }
     }
  }.fp(List(2,3), Dictionary(1,True, 2,True, 3,True))).push(1,2,3);
}</lang> <lang zkl>println("The first 30 entries of the Yellowstone permutation:"); yellowstoneW().walk(30).concat(", ").println();</lang>
- Output:
The first 30 entries of the Yellowstone permutation:
1, 2, 3, 4, 9, 8, 15, 14, 5, 6, 25, 12, 35, 16, 7, 10, 21, 20, 27, 22, 39, 11, 13, 33, 26, 45, 28, 51, 32, 17
Plot using Gnuplot <lang zkl>gnuplot:=System.popen("gnuplot","w"); gnuplot.writeln("unset key; plot '-'"); yellowstoneW().pump(1_000, gnuplot.writeln.fp(" ")); // " 1\n", " 2\n", ... gnuplot.writeln("e"); gnuplot.flush(); ask("Hit return to finish"); gnuplot.close();</lang> Offsite Image: yellowstone