
Archimedean spiral

You are encouraged to solve this task according to the task description, using any language you may know.
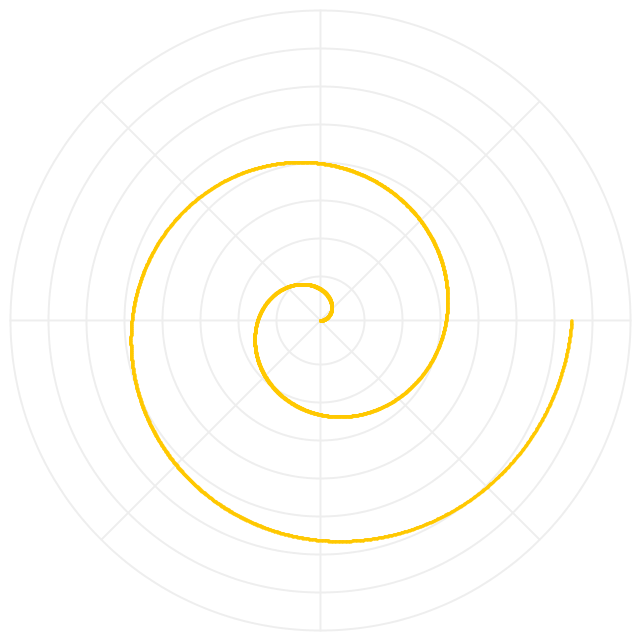
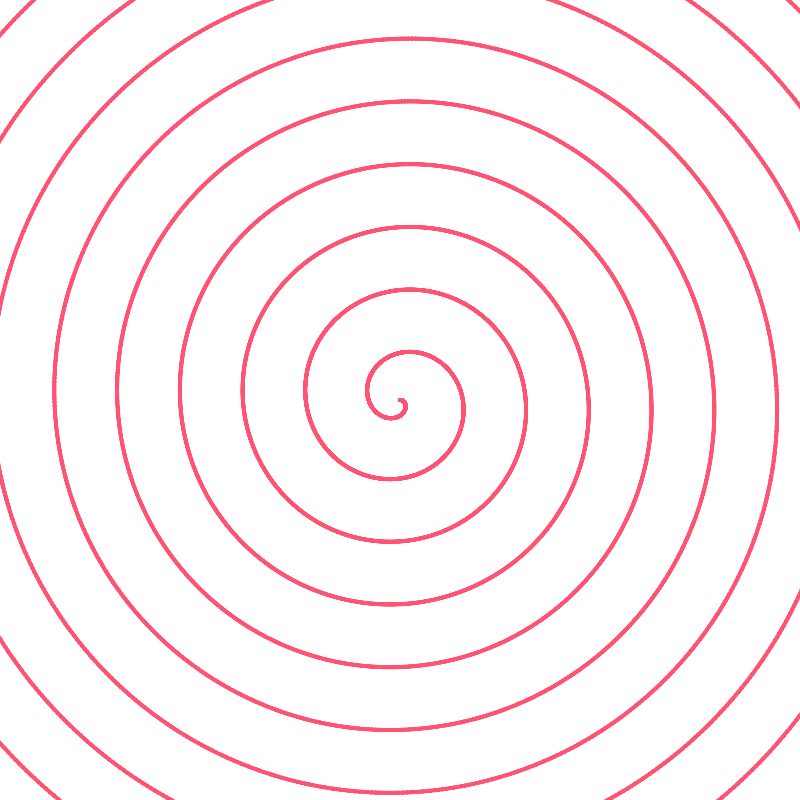
The Archimedean spiral is a spiral named after the Greek mathematician Archimedes.
An Archimedean spiral can be described by the equation:

with real numbers a and b.
- Task
Draw an Archimedean spiral.
Ada
<lang Ada>with Ada.Numerics.Elementary_Functions;
with SDL.Video.Windows.Makers; with SDL.Video.Renderers.Makers; with SDL.Events.Events;
procedure Archimedean_Spiral is
  Width      : constant := 800;
  Height     : constant := 800;
  A          : constant := 4.2;
  B          : constant := 3.2;
  T_First    : constant := 4.0;
  T_Last     : constant := 100.0;
  Window   : SDL.Video.Windows.Window;
  Renderer : SDL.Video.Renderers.Renderer;
  Event    : SDL.Events.Events.Events;
  procedure Draw_Archimedean_Spiral is
     use type SDL.C.int;
     use Ada.Numerics.Elementary_Functions;
     Pi   : constant := Ada.Numerics.Pi;
     Step : constant := 0.002;
     T    : Float;
     R    : Float;
  begin
     T := T_First;
     loop
        R := A + B * T;
        Renderer.Draw
          (Point => (X => Width  / 2 + SDL.C.int (R * Cos (T, 2.0 * Pi)),
                     Y => Height / 2 - SDL.C.int (R * Sin (T, 2.0 * Pi))));
        exit when T >= T_Last;
        T := T + Step;
     end loop;
  end Draw_Archimedean_Spiral;
  procedure Wait is
     use type SDL.Events.Event_Types;
  begin
     loop
        while SDL.Events.Events.Poll (Event) loop
           if Event.Common.Event_Type = SDL.Events.Quit then
              return;
           end if;
        end loop;
     end loop;
  end Wait;
begin
  if not SDL.Initialise (Flags => SDL.Enable_Screen) then
     return;
  end if;
  SDL.Video.Windows.Makers.Create (Win      => Window,
                                   Title    => "Archimedean spiral",
                                   Position => SDL.Natural_Coordinates'(X => 10, Y => 10),
                                   Size     => SDL.Positive_Sizes'(Width, Height),
                                   Flags    => 0);
  SDL.Video.Renderers.Makers.Create (Renderer, Window.Get_Surface);
  Renderer.Set_Draw_Colour ((0, 0, 0, 255));
  Renderer.Fill (Rectangle => (0, 0, Width, Height));
  Renderer.Set_Draw_Colour ((0, 220, 0, 255));
  Draw_Archimedean_Spiral;
  Window.Update_Surface;
  Wait;
  Window.Finalize;
  SDL.Finalise;
end Archimedean_Spiral;</lang>
AWK
<lang AWK>
- syntax: GAWK -f ARCHIMEDEAN_SPIRAL.AWK
- converted from Applesoft BASIC
BEGIN {
   x_min = y_min = 9999
   x_max = y_max = 0
   h = 96
   w = h + h / 2
   a = 1
   b = 1
   m = 6 * 3.1415926
   step = .02
   for (t=step; t<=m; t+=step) { # build spiral
     r = a + b * t
     x = int(r * cos(t) + w)
     y = int(r * sin(t) + h)
     if (x <= 0 || y <= 0) { continue }
     if (x >= 280 ) { continue }
     if (y >= 192) { continue }
     arr[x,y] = "*"
     x_min = min(x_min,x)
     x_max = max(x_max,x)
     y_min = min(y_min,y)
     y_max = max(y_max,y)
   }
   for (i=x_min; i<=x_max; i++) { # print spiral
     rec = ""
     for (j=y_min; j<=y_max; j++) {
       rec = sprintf("%s%1s",rec,arr[i,j])
     }
     printf("%s\n",rec)
   }
   exit(0)
} function max(x,y) { return((x > y) ? x : y) } function min(x,y) { return((x < y) ? x : y) } </lang>
- Output:
             **********
          ***          ***
         **              **
       **                  **
      **                    **
     **                      **
    **         *******        **
   **       ***      ***       *
   *       **          **      **
  **      **            **      *
  *      **              **     **
 **     **                *      *
 *      *       ****       *     *
 *     *      ***  **      *     **
**     *      *     **     *      *
*      *     **      *     *      *
*      *     *       *     *      *
*     **     *      **     *      *
*     **     *     **      *     **
*      *     *            **     *
*      *     *            *      *
**     *      *          **     **
 *     *      **        **      *
 *      *      ***    ***      **
 **     **       ******        *
  *      *                    **
  *      **                  **
   *       **               **
   **       **            **
    *        ****       ***
     *          ********
      *
       *
        **
         ***
           ****
              *****
BASIC
Applesoft BASIC
<lang ApplesoftBasic>110 LET H = 96 120 LET W = H + H / 2 130 HGR2 140 HCOLOR= 3 150 LET A = 1 160 LET B = 9 170 LET PI = 3.1415926535 180 LET M = 10 * PI 190 LET S = .02 200 FOR T = S TO M STEP S 210 LET R = A + B * T 220 LET X = R * COS (T) + W 230 LET Y = R * SIN (T) + H 240 IF X < 0 THEN 290 250 IF Y < 0 THEN 290 260 IF X > 279 THEN 290 270 IF Y > 191 THEN 290 280 HPLOT X,Y 290 NEXT </lang>
BASIC256
<lang BASIC256>
- Basic-256 ver 1.1.4
- Archimedean Spiral
width = 430 : height = 430 graphsize width, height rect 0,0, graphwidth,graphheight penwidth 1 color green
x = width/2 : y = height/2 # Center of graphics window i = 1 : t = 0 : xn = 0 : yn = 0 # Initial values iter = 150 : q = 30
line x,0,x,height
line 0,y,width,y
penwidth 2 color red
while i <= iter
   t = i / q * pi
   xn = (1 + (1 * t)) * cos(t) +x
   yn = (1 + (1 * t)) * sin(t) +y
   line x,y,xn,yn
   x = xn : y = yn
   print i + chr(9) + int(x) + chr(9) + int(y) + chr(9) + int(t)    # chr(9) = TAB
   i += 1
end while
imgsave "spiral-Basic-256.png", "PNG" </lang>
Commodore BASIC
Commodore BASIC 2.0 lacks in-built graphics capability. This implementation is written for Commodore BASIC 7.0 that was built into the Commodore 128 computer. Should also work for Commodore BASIC 3.5. <lang basic>1 REM ARCHIMEDEAN SPIRAL 2 REM USING COMMODORE BASIC 7.0 3 REM OF THE COMMODORE 128 4 REM ********************************** 10 GRAPHIC 1,1 20 A = 1.5 30 B = 0.7 40 X0 = 160 : Y0 = 100 50 FOR T = 0 TO 40*π STEP 0.2 60 R = A+B*T 70 X = R*COS(T)+160 : Y = R*SIN(T)+100 80 DRAW 1,X0,Y0 TO X,Y 90 X0 = X : Y0 = Y 100 NEXT T 110 GOTO 110</lang>
FreeBASIC
<lang freebasic>' version 16-10-2016 ' compile with: fbc -s gui
Const As double deg2rad = Atn(1) * 4 / 180 ' pi = atn(1) * 4, pi/180
Const As UInteger screensize = 600 ' size of window in pixels Const As Double turns = 5 ' number of turns Const As UInteger halfscrn = screensize \ 2 Const As uinteger sf = (turns * (screensize - 100)) / halfscrn
ScreenRes screensize, screensize, 32 ' screen 600 * 600 pixels, 4 byte color
Dim As Double r, x, y
For r = 0 To turns * 360 Step 0.05
 x = Cos(r * deg2rad) * r / sf
 y = Sin(r * deg2rad) * r / sf
 PSet(halfscrn + x, halfscrn - y), RGB(255, 255, 255)
Next
' empty keyboard buffer
While InKey <> "" : Wend
Print : Print "hit any key to end program"
Sleep
End</lang>
IS-BASIC
<lang IS-BASIC>100 GRAPHICS LORES 2 110 OPTION ANGLE DEGREES 120 PLOT 640,360,ANGLE 90; 130 FOR I=2 TO 33.2 STEP .05 140 PLOT FORWARD I,LEFT 5; 150 NEXT</lang>
Run BASIC
<lang Run BASIC> 'archimedean spiral.bas
   'runs in Run Basic
   'Run Basic website http://www.runbasic.com
   'From Rosettacode.org/wiki/ *** Liberty_BASIC
 graphic #g, 300,300 'width and height - the center is 150
 c = 255  '255 for white '0 for black
 print "Welcome to the Arch-Spiral Program"
 pi=acs(-1)
 nLoops = 5
  #g cls("blue") 'blue background color
  #g color(c,c,c) 'set line color - see color above
 for t=0 to 2*pi*nLoops step 0.01
    'c = c - 1  'changes color parameter
    x=100*t/(2*pi*nLoops)*cos(t)+150  '150x150 is the center
    y=100*t/(2*pi*nLoops)*sin(t)+150
    #g color(c,c,c)  'changes color
    #g set(x,y)
    'if c <1 then c=255
 next
   render #g
 print "Thank you and Goodbye"
 end
End</lang>
QBASIC
<lang basic>SCREEN 12 WINDOW (-2.67, -2!)-(2.67, 2!) PI = 4 * ATN(1) H = PI / 40 A = .2: B = .05 PSET (A, 0) FOR I = 0 TO 400
   T = I * H
   X = (A + B * T) * COS(T)
   Y = (A + B * T) * SIN(T)
   LINE -(X, Y)
NEXT</lang>
Sinclair ZX81 BASIC
Works with the unexpanded (1k RAM) ZX81. The output is quite blocky, but identifiably a spiral. <lang basic>10 LET A=1.5 20 LET B=0.7 30 FOR T=0 TO 7*PI STEP 0.05 40 LET R=A+B*T 50 PLOT R*COS T+32,R*SIN T+22 60 NEXT T</lang>
- Output:
Screenshot here.
C
Interactive code which asks the parameters a and b as inputs, the number of cycles and the division steps. Requires the WinBGIm library. <lang C>
- include<graphics.h>
- include<stdio.h>
- include<math.h>
- define pi M_PI
int main(){ double a,b,cycles,incr,i;
int steps,x=500,y=500;
printf("Enter the parameters a and b : "); scanf("%lf%lf",&a,&b);
printf("Enter cycles : "); scanf("%lf",&cycles);
printf("Enter divisional steps : "); scanf("%d",&steps);
incr = 1.0/steps;
initwindow(1000,1000,"Archimedean Spiral");
for(i=0;i<=cycles*pi;i+=incr){ putpixel(x + (a + b*i)*cos(i),x + (a + b*i)*sin(i),15); }
getch();
closegraph(); } </lang>
C++

<lang cpp>
- include <windows.h>
- include <string>
- include <iostream>
const int BMP_SIZE = 600;
class myBitmap { public:
   myBitmap() : pen( NULL ), brush( NULL ), clr( 0 ), wid( 1 ) {}
   ~myBitmap() {
       DeleteObject( pen ); DeleteObject( brush );
       DeleteDC( hdc ); DeleteObject( bmp );
   }
   bool create( int w, int h ) {
       BITMAPINFO bi;
       ZeroMemory( &bi, sizeof( bi ) );
       bi.bmiHeader.biSize        = sizeof( bi.bmiHeader );
       bi.bmiHeader.biBitCount    = sizeof( DWORD ) * 8;
       bi.bmiHeader.biCompression = BI_RGB;
       bi.bmiHeader.biPlanes      = 1;
       bi.bmiHeader.biWidth       =  w;
       bi.bmiHeader.biHeight      = -h;
       HDC dc = GetDC( GetConsoleWindow() );
       bmp = CreateDIBSection( dc, &bi, DIB_RGB_COLORS, &pBits, NULL, 0 );
       if( !bmp ) return false;
       hdc = CreateCompatibleDC( dc );
       SelectObject( hdc, bmp );
       ReleaseDC( GetConsoleWindow(), dc );
       width = w; height = h;
       return true;
   }
   void clear( BYTE clr = 0 ) {
       memset( pBits, clr, width * height * sizeof( DWORD ) );
   }
   void setBrushColor( DWORD bClr ) {
       if( brush ) DeleteObject( brush );
       brush = CreateSolidBrush( bClr );
       SelectObject( hdc, brush );
   }
   void setPenColor( DWORD c ) {
       clr = c; createPen();
   }
   void setPenWidth( int w ) {
       wid = w; createPen();
   }
   void saveBitmap( std::string path ) {
       BITMAPFILEHEADER fileheader;
       BITMAPINFO       infoheader;
       BITMAP           bitmap;
       DWORD            wb;
       GetObject( bmp, sizeof( bitmap ), &bitmap );
       DWORD* dwpBits = new DWORD[bitmap.bmWidth * bitmap.bmHeight];
       ZeroMemory( dwpBits, bitmap.bmWidth * bitmap.bmHeight * sizeof( DWORD ) );
       ZeroMemory( &infoheader, sizeof( BITMAPINFO ) );
       ZeroMemory( &fileheader, sizeof( BITMAPFILEHEADER ) );
       infoheader.bmiHeader.biBitCount = sizeof( DWORD ) * 8;
       infoheader.bmiHeader.biCompression = BI_RGB;
       infoheader.bmiHeader.biPlanes = 1;
       infoheader.bmiHeader.biSize = sizeof( infoheader.bmiHeader );
       infoheader.bmiHeader.biHeight = bitmap.bmHeight;
       infoheader.bmiHeader.biWidth = bitmap.bmWidth;
       infoheader.bmiHeader.biSizeImage = bitmap.bmWidth * bitmap.bmHeight * sizeof( DWORD );
       fileheader.bfType    = 0x4D42;
       fileheader.bfOffBits = sizeof( infoheader.bmiHeader ) + sizeof( BITMAPFILEHEADER );
       fileheader.bfSize    = fileheader.bfOffBits + infoheader.bmiHeader.biSizeImage;
       GetDIBits( hdc, bmp, 0, height, ( LPVOID )dwpBits, &infoheader, DIB_RGB_COLORS );
       HANDLE file = CreateFile( path.c_str(), GENERIC_WRITE, 0, NULL, CREATE_ALWAYS,
                                 FILE_ATTRIBUTE_NORMAL, NULL );
       WriteFile( file, &fileheader, sizeof( BITMAPFILEHEADER ), &wb, NULL );
       WriteFile( file, &infoheader.bmiHeader, sizeof( infoheader.bmiHeader ), &wb, NULL );
       WriteFile( file, dwpBits, bitmap.bmWidth * bitmap.bmHeight * 4, &wb, NULL );
       CloseHandle( file );
       delete [] dwpBits;
   }
   HDC getDC() const     { return hdc; }
   int getWidth() const  { return width; }
   int getHeight() const { return height; }
private:
   void createPen() {
       if( pen ) DeleteObject( pen );
       pen = CreatePen( PS_SOLID, wid, clr );
       SelectObject( hdc, pen );
   }
   HBITMAP bmp; HDC    hdc;
   HPEN    pen; HBRUSH brush;
   void    *pBits; int    width, height, wid;
   DWORD    clr;
}; class spiral { public:
   spiral() {
       bmp.create( BMP_SIZE, BMP_SIZE );
   }
   void draw( int c, int s ) {
       double a = .2, b = .3, r, x, y;
       int w = BMP_SIZE >> 1;
       HDC dc = bmp.getDC();
       for( double d = 0; d < c * 6.28318530718; d += .002 ) {
           r = a + b * d; x = r * cos( d ); y = r * sin( d );
           SetPixel( dc, ( int )( s * x + w ), ( int )( s * y + w ), 255 );
       }
       // saves the bitmap
       bmp.saveBitmap( "./spiral.bmp" );
   }
private:
myBitmap bmp;
}; int main(int argc, char* argv[]) {
spiral s; s.draw( 16, 8 ); return 0;
} </lang>
C#
<lang csharp>using System; using System.Linq; using System.Drawing; using System.Diagnostics; using System.Drawing.Drawing2D;
class Program {
   const int width = 380;
   const int height = 380;
   static PointF archimedeanPoint(int degrees)
   {
       const double a = 1;
       const double b = 9;
       double t = degrees * Math.PI / 180;
       double r = a + b * t;
       return new PointF { X = (float)(width / 2 + r * Math.Cos(t)), Y = (float)(height / 2 + r * Math.Sin(t)) };
   }
   static void Main(string[] args)
   {
       var bm = new Bitmap(width, height);
       var g = Graphics.FromImage(bm);
       g.SmoothingMode = SmoothingMode.AntiAlias;
       g.FillRectangle(new SolidBrush(Color.White), new Rectangle { X = 0, Y = 0, Width = width, Height = height });
       var pen = new Pen(Color.OrangeRed, 1.5f);
       var spiral = Enumerable.Range(0, 360 * 3).AsParallel().AsOrdered().Select(archimedeanPoint);
       var p0 = new PointF(width / 2, height / 2);
       foreach (var p1 in spiral)
       {
           g.DrawLine(pen, p0, p1);
           p0 = p1;
       }
       g.Save(); // is this really necessary ?
       bm.Save("archimedes-csharp.png");
       Process.Start("archimedes-csharp.png"); // Launches default photo viewing app
   }
} </lang>
Common Lisp
Common Lisp doesn't provide native graphical output. Libraries or bitmapped output could be used instead, but for this solution, the output is accomplished with character printing.
<lang lisp>(defun draw-coords-as-text (coords size fill-char)
 (let* ((min-x (apply #'min (mapcar #'car coords)))
        (min-y (apply #'min (mapcar #'cdr coords)))
        (max-x (apply #'max (mapcar #'car coords)))
        (max-y (apply #'max (mapcar #'cdr coords)))
        (real-size (max (+ (abs min-x) (abs max-x)) ; bounding square
                        (+ (abs min-y) (abs max-y))))
        (scale-factor (* (1- size) (/ 1 real-size)))
        (center-x (* scale-factor -1 min-x))
        (center-y (* scale-factor -1 min-y))
        (intermediate-result (make-array (list size size)
                                         :element-type 'char
                                         :initial-element #\space)))
   (dolist (c coords)
     (let ((final-x (floor (+ center-x (* scale-factor (car c)))))
           (final-y (floor (+ center-y (* scale-factor (cdr c))))))
       (setf (aref intermediate-result final-x final-y)
             fill-char)))
   ; print results to output
   (loop for i below (array-total-size intermediate-result) do
         (when (zerop (mod i size))
           (terpri))
         (princ (row-major-aref intermediate-result i)))))
(defun spiral (a b step-resolution step-count)
 "Returns a list of coordinates for r=a+b*theta stepping theta by step-resolution"
 (loop for theta
       from 0 upto (* step-count step-resolution)
       by step-resolution
       for r = (+ a (* b theta))
       for x = (* r (cos theta))
       for y = (* r (sin theta))
       collect (cons x y)))
(draw-coords-as-text (spiral 10 10 0.01 1500) 30 #\*)
- Output
- *
- ****** *
- **** *** **
- *** ** *
- ** ** *
- ** ** *
- * ** **
- ** * *
- ** ****** * *
- * ** ** ** *
- * ** * * *
- * ** * * **
- * * * * *
- * * * ** * *
- * * *** ** *
- * ** * *
- * * ** *
- * ** ** **
- ** ** ** *
- * ** ** **
- ** ******** *
- * **
- ** **
- ** **
- ** ***
- ** **
- **** ***
- *******
</lang>
Clojure
<lang clojure> (use '(incanter core stats charts io))
(defn Arquimidean-function
 [a b theta]
 (+ a (* theta b)))
(defn transform-pl-xy [r theta]
 (let [x (* r (sin theta))
       y (* r (cos theta))]
   [x y]))
(defn arq-spiral [t] (transform-pl-xy (Arquimidean-function 0 7 t) t))
(view (parametric-plot arq-spiral 0 (* 10 Math/PI)))
</lang>
Frege
<lang frege>module Archimedean where
import Java.IO import Prelude.Math
data BufferedImage = native java.awt.image.BufferedImage where
 pure native type_3byte_bgr "java.awt.image.BufferedImage.TYPE_3BYTE_BGR" :: Int
 native new :: Int -> Int -> Int -> STMutable s BufferedImage
 native createGraphics :: Mutable s BufferedImage -> STMutable s Graphics2D
data Color = pure native java.awt.Color where
 pure native orange "java.awt.Color.orange" :: Color
 pure native white "java.awt.Color.white" :: Color
 pure native new :: Int -> Color
data BasicStroke = pure native java.awt.BasicStroke where
pure native new :: Float -> BasicStroke
data RenderingHints = native java.awt.RenderingHints where
 pure native key_antialiasing "java.awt.RenderingHints.KEY_ANTIALIASING" :: RenderingHints_Key
 pure native value_antialias_on "java.awt.RenderingHints.VALUE_ANTIALIAS_ON" :: Object
data RenderingHints_Key = pure native java.awt.RenderingHints.Key
data Graphics2D = native java.awt.Graphics2D where
 native drawLine :: Mutable s Graphics2D -> Int -> Int -> Int -> Int -> ST s ()
 native drawOval :: Mutable s Graphics2D -> Int -> Int -> Int -> Int -> ST s ()
 native fillRect :: Mutable s Graphics2D -> Int -> Int -> Int -> Int -> ST s ()
 native setColor :: Mutable s Graphics2D -> Color -> ST s ()
 native setRenderingHint :: Mutable s Graphics2D -> RenderingHints_Key -> Object -> ST s ()
 native setStroke :: Mutable s Graphics2D -> BasicStroke -> ST s ()
data ImageIO = mutable native javax.imageio.ImageIO where
native write "javax.imageio.ImageIO.write" :: MutableIO BufferedImage -> String -> MutableIO File -> IO Bool throws IOException
width = 640 center = width `div` 2
roundi = fromIntegral . round
drawGrid :: Mutable s Graphics2D -> ST s () drawGrid g = do
 g.setColor $ Color.new 0xEEEEEE
 g.setStroke $ BasicStroke.new 2
 let angle = toRadians 45
     margin = 10
     numRings = 8
     spacing = (width - 2 * margin) `div` (numRings * 2)
 forM_ [0 .. numRings-1] $ \i -> do
   let pos = margin + i * spacing
       size = width - (2 * margin + i * 2 * spacing)
       ia = fromIntegral i * angle
       multiplier = fromIntegral $ (width - 2 * margin) `div` 2
       x2 = center + (roundi (cos ia * multiplier))
       y2 = center - (roundi (sin ia * multiplier))
   g.drawOval pos pos size size
   g.drawLine center center x2 y2
drawSpiral :: Mutable s Graphics2D -> ST s () drawSpiral g = do
 g.setStroke $ BasicStroke.new 2
 g.setColor $ Color.orange
 let degrees = toRadians 0.1
     end = 360 * 2 * 10 * degrees
     a = 0
     b = 20
     c = 1
     drSp theta = do
       let r = a + b * theta ** (1 / c)
           x = r * cos theta
           y = r * sin theta
           theta' = theta + degrees
       plot g (center + roundi x) (center - roundi y)
       when (theta' < end) (drSp (theta' + degrees))
 drSp 0
plot :: Mutable s Graphics2D -> Int -> Int -> ST s () plot g x y = g.drawOval x y 1 1
main = do
 buffy <- BufferedImage.new width width BufferedImage.type_3byte_bgr
 g <- buffy.createGraphics
 g.setRenderingHint RenderingHints.key_antialiasing RenderingHints.value_antialias_on
 g.setColor Color.white
 g.fillRect 0 0 width width
 drawGrid g
 drawSpiral g
 f <- File.new "SpiralFrege.png"
 void $ ImageIO.write buffy "png" f</lang>
Output is here due to Is file uploading blocked forever?
Go
Creates a PNG file using only built-in packages. <lang go>package main
import ( "image" "image/color" "image/draw" "image/png" "log" "math" "os" )
func main() { const ( width, height = 600, 600 centre = width / 2.0 degreesIncr = 0.1 * math.Pi / 180 turns = 2 stop = 360 * turns * 10 * degreesIncr fileName = "spiral.png" )
img := image.NewNRGBA(image.Rect(0, 0, width, height)) // create new image bg := image.NewUniform(color.RGBA{255, 255, 255, 255}) // prepare white for background draw.Draw(img, img.Bounds(), bg, image.ZP, draw.Src) // fill the background fgCol := color.RGBA{255, 0, 0, 255} // red plot
a := 1.0 b := 20.0
for theta := 0.0; theta < stop; theta += degreesIncr { r := a + b*theta x := r * math.Cos(theta) y := r * math.Sin(theta) img.Set(int(centre+x), int(centre-y), fgCol) }
imgFile, err := os.Create(fileName) if err != nil { log.Fatal(err) } defer imgFile.Close()
if err := png.Encode(imgFile, img); err != nil { imgFile.Close() log.Fatal(err) } }</lang>
Haskell
<lang haskell>#!/usr/bin/env stack -- stack --resolver lts-7.0 --install-ghc runghc --package Rasterific --package JuicyPixels
import Codec.Picture( PixelRGBA8( .. ), writePng ) import Graphics.Rasterific import Graphics.Rasterific.Texture import Graphics.Rasterific.Transformations
archimedeanPoint a b t = V2 x y
 where r = a + b * t
       x = r * cos t
       y = r * sin t
main :: IO () main = do
 let white = PixelRGBA8 255 255 255 255
     drawColor = PixelRGBA8 0xFF 0x53 0x73 255
     size = 800
     points = map (archimedeanPoint 0 10) [0, 0.01 .. 60]
     hSize = fromIntegral size / 2
     img = renderDrawing size size white $
           withTransformation (translate $ V2 hSize hSize) $
           withTexture (uniformTexture drawColor) $
           stroke 4 JoinRound (CapRound, CapRound) $
           polyline points
writePng "SpiralHaskell.png" img</lang>
Output is here due to Is file uploading blocked forever?
J

<lang j>require'plot' 'aspect 1' plot (*^)j.0.01*i.1400</lang>
Java

<lang java>import java.awt.*; import static java.lang.Math.*; import javax.swing.*;
public class ArchimedeanSpiral extends JPanel {
   public ArchimedeanSpiral() {
       setPreferredSize(new Dimension(640, 640));
       setBackground(Color.white);
   }
   void drawGrid(Graphics2D g) {
       g.setColor(new Color(0xEEEEEE));
       g.setStroke(new BasicStroke(2));
double angle = toRadians(45);
       int w = getWidth();
       int center = w / 2;
       int margin = 10;
       int numRings = 8;
int spacing = (w - 2 * margin) / (numRings * 2);
       for (int i = 0; i < numRings; i++) {
           int pos = margin + i * spacing;
           int size = w - (2 * margin + i * 2 * spacing);
           g.drawOval(pos, pos, size, size);
           double ia = i * angle;
           int x2 = center + (int) (cos(ia) * (w - 2 * margin) / 2);
           int y2 = center - (int) (sin(ia) * (w - 2 * margin) / 2);
           g.drawLine(center, center, x2, y2);
       }
   }
   void drawSpiral(Graphics2D g) {
       g.setStroke(new BasicStroke(2));
       g.setColor(Color.orange);
       double degrees = toRadians(0.1);
       double center = getWidth() / 2;
       double end = 360 * 2 * 10 * degrees;
       double a = 0;
       double b = 20;
       double c = 1;
       for (double theta = 0; theta < end; theta += degrees) {
           double r = a + b * pow(theta, 1 / c);
           double x = r * cos(theta);
           double y = r * sin(theta);
           plot(g, (int) (center + x), (int) (center - y));
       }
   }
   void plot(Graphics2D g, int x, int y) {
       g.drawOval(x, y, 1, 1);
   }
   @Override
   public void paintComponent(Graphics gg) {
       super.paintComponent(gg);
       Graphics2D g = (Graphics2D) gg;
       g.setRenderingHint(RenderingHints.KEY_ANTIALIASING,
               RenderingHints.VALUE_ANTIALIAS_ON);
       drawGrid(g);
       drawSpiral(g);
   }
   public static void main(String[] args) {
       SwingUtilities.invokeLater(() -> {
           JFrame f = new JFrame();
           f.setDefaultCloseOperation(JFrame.EXIT_ON_CLOSE);
           f.setTitle("Archimedean Spiral");
           f.setResizable(false);
           f.add(new ArchimedeanSpiral(), BorderLayout.CENTER);
           f.pack();
           f.setLocationRelativeTo(null);
           f.setVisible(true);
       });
   }
}</lang>
JavaScript
ES5
<lang html> <html> <head><title>Archimedean spiral</title></head> <body onload="pAS(35,'navy');">
Archimedean spiral
<canvas id="canvId" width="640" height="640" style="border: 2px outset;"></canvas> <script> // Plotting Archimedean_spiral aev 3/17/17 // lps - number of loops, clr - color. function pAS(lps,clr) {
 var a=.0,ai=.1,r=.0,ri=.1,as=lps*2*Math.PI,n=as/ai;
 var cvs=document.getElementById("canvId");
 var ctx=cvs.getContext("2d");
 ctx.fillStyle="white"; ctx.fillRect(0,0,cvs.width,cvs.height);
 var x=y=0, s=cvs.width/2;
 ctx.beginPath();
 for (var i=1; i<n; i++) {
   x=r*Math.cos(a), y=r*Math.sin(a);
   ctx.lineTo(x+s,y+s);
   r+=ri; a+=ai;
 }//fend i
 ctx.strokeStyle = clr; ctx.stroke();
} </script></body></html> </lang>
- Output:
Page with Archimedean spiral like ASjs.png. Right-clicking on the canvas you can save
spiral as a png-file, for example.
ES6
Assumes the same HTML canvas embedding as above, but is functionally composed. Defines and logs a set of points, before rendering them to canvas. <lang html><html> <head>
   <title>Archimedean spiral</title>
   <style>h3 {font-family:sans-serif; color:gray;}</style>
</head> <body onload="main('red')(15)">
Archimedean spiral
<canvas id="spiral" width="640" height="640" style="border: 2px outset;"></canvas> <script></lang> <lang javascript>const main = strColor => intCycles => {
   const
       ai = 0.05,
       ri = 0.1,
       cvs = document.getElementById('spiral'),
       ctx = cvs.getContext('2d'),
       s = cvs.width / 2,
       points = enumFromTo(1)(
           Math.PI * 2 * intCycles / ai
       ).map(i => [Math.cos, Math.sin].map(
           f => ri * i * f(ai * i) + s
       ));
   return (
       console.log(points),
       ctx.fillStyle = 'white',
       ctx.fillRect(0, 0, cvs.width, cvs.height),
       ctx.beginPath(),
points.forEach(xy => ctx.lineTo(...xy)),
       ctx.strokeStyle = strColor,
       ctx.stroke(),
       points
   );
};
// enumFromTo :: Int -> Int -> [Int] const enumFromTo = m => n =>
   Array.from({
       length: 1 + n - m
   }, (_, i) => m + i);</lang>
<lang html></script></body></html></lang>
Julia
<lang julia>using UnicodePlots
spiral(θ, a=0, b=1) = @. b * θ * cos(θ + a), b * θ * sin(θ + a)
x, y = spiral(1:0.1:10) println(lineplot(x, y))</lang>
- Output:
       ┌────────────────────────────────────────┐
    10 │⠀⠀⠀⠀⠀⠀⠀⠀⠀⠀⠀⠀⠀⠀⠀⠀⠀⠀⠀⠀⡆⠀⠀⠀⠀⠀⠀⠀⠀⠀⠀⠀⠀⠀⠀⠀⠀⠀⠀⠀│
       │⠀⠀⠀⠀⠀⠀⠀⠀⠀⠀⠀⠀⣀⣀⠤⠤⠤⠤⠤⠤⡧⠤⣀⣀⠀⠀⠀⠀⠀⠀⠀⠀⠀⠀⠀⠀⠀⠀⠀⠀│
       │⠀⠀⠀⠀⠀⠀⠀⢀⡠⠔⠊⠉⠀⠀⠀⠀⠀⠀⠀⠀⡇⠀⠀⠀⠉⠓⠤⢄⠀⠀⠀⠀⠀⠀⠀⠀⠀⠀⠀⠀│
       │⠀⠀⠀⠀⠀⡠⠊⠁⠀⠀⠀⠀⠀⠀⠀⠀⠀⠀⠀⠀⡇⠀⠀⠀⠀⠀⠀⠀⠉⠢⡀⠀⠀⠀⠀⠀⠀⠀⠀⠀│
       │⠀⠀⠀⡠⠊⠀⠀⠀⠀⠀⠀⠀⠀⠀⠀⠀⠀⠀⠀⠀⡇⠀⠀⠀⠀⠀⠀⠀⠀⠀⠘⢤⠀⠀⠀⠀⠀⠀⠀⠀│
       │⠀⠀⡜⠀⠀⠀⠀⠀⠀⠀⠀⠀⠀⠀⠀⠀⠀⠀⠀⠀⡇⠀⠀⠀⠀⠀⠀⠀⠀⠀⠀⠀⢇⠀⠀⠀⠀⠀⠀⠀│
       │⠀⡸⠀⠀⠀⠀⠀⠀⠀⠀⠀⠀⠀⠀⣀⠔⠊⠉⠉⠙⣧⡀⠀⠀⠀⠀⠀⠀⠀⠀⠀⠀⢸⠀⠀⠀⠀⠀⠀⠀│
       │⠤⡧⠤⠤⠤⠤⠤⠤⠤⠤⠤⠤⠤⡴⠥⠤⠤⠤⠤⠤⡧⠤⠤⠤⠤⠤⠤⠤⠤⠤⠤⠤⡼⠤⠤⠤⠤⠤⠤⠄│
       │⠀⡇⠀⠀⠀⠀⠀⠀⠀⠀⠀⠀⠀⢣⠀⠀⠀⠀⠀⠀⡇⠀⠀⠀⠀⠀⠀⠀⠀⠀⠀⣰⠁⠀⠀⠀⠀⠀⠀⠀│
       │⠀⢇⠀⠀⠀⠀⠀⠀⠀⠀⠀⠀⠀⠈⢆⠀⠀⠀⠀⠀⡇⠀⠀⠀⠀⠀⠀⠀⠀⣀⠜⠀⠀⠀⠀⠀⠀⠀⠀⠀│
       │⠀⠘⡄⠀⠀⠀⠀⠀⠀⠀⠀⠀⠀⠀⠀⠉⠒⠤⣀⡀⡇⠀⠀⠀⣀⣀⠤⠔⠊⠀⠀⠀⠀⠀⠀⠀⠀⠀⠀⠀│
       │⠀⠀⠘⠀⠀⠀⠀⠀⠀⠀⠀⠀⠀⠀⠀⠀⠀⠀⠀⠈⡏⠉⠉⠉⠀⠀⠀⠀⠀⠀⠀⠀⠀⠀⠀⠀⠀⠀⠀⠀│
       │⠀⠀⠀⠀⠀⠀⠀⠀⠀⠀⠀⠀⠀⠀⠀⠀⠀⠀⠀⠀⡇⠀⠀⠀⠀⠀⠀⠀⠀⠀⠀⠀⠀⠀⠀⠀⠀⠀⠀⠀│
       │⠀⠀⠀⠀⠀⠀⠀⠀⠀⠀⠀⠀⠀⠀⠀⠀⠀⠀⠀⠀⡇⠀⠀⠀⠀⠀⠀⠀⠀⠀⠀⠀⠀⠀⠀⠀⠀⠀⠀⠀│
   -10 │⠀⠀⠀⠀⠀⠀⠀⠀⠀⠀⠀⠀⠀⠀⠀⠀⠀⠀⠀⠀⡇⠀⠀⠀⠀⠀⠀⠀⠀⠀⠀⠀⠀⠀⠀⠀⠀⠀⠀⠀│
       └────────────────────────────────────────┘
       -10                                     10
Kotlin
<lang scala>// version 1.1.0
import java.awt.* import javax.swing.*
class ArchimedeanSpiral : JPanel() {
   init {
       preferredSize = Dimension(640, 640)
       background = Color.white
   }
   private fun drawGrid(g: Graphics2D) {
       g.color = Color(0xEEEEEE)
       g.stroke = BasicStroke(2f)
       val angle = Math.toRadians(45.0)
       val w = width
       val center = w / 2
       val margin = 10
       val numRings = 8
       val spacing = (w - 2 * margin) / (numRings * 2)
       for (i in 0 until numRings) {
           val pos = margin + i * spacing
           val size = w - (2 * margin + i * 2 * spacing)
           g.drawOval(pos, pos, size, size)
           val ia = i * angle
           val x2 = center + (Math.cos(ia) * (w - 2 * margin) / 2).toInt()
           val y2 = center - (Math.sin(ia) * (w - 2 * margin) / 2).toInt()
           g.drawLine(center, center, x2, y2)
       }
   }
   private fun drawSpiral(g: Graphics2D) {
       g.stroke = BasicStroke(2f)
       g.color = Color.magenta
       val degrees = Math.toRadians(0.1)
       val center = width / 2
       val end = 360 * 2 * 10 * degrees
       val a = 0.0
       val b = 20.0
       val c = 1.0
       var theta = 0.0
       while (theta < end) {
           val r = a + b * Math.pow(theta, 1.0 / c)
           val x = r * Math.cos(theta)
           val y = r * Math.sin(theta)
           plot(g, (center + x).toInt(), (center - y).toInt())
           theta += degrees
       }
   }
   private fun plot(g: Graphics2D, x: Int, y: Int) {
       g.drawOval(x, y, 1, 1)
   }
   override fun paintComponent(gg: Graphics) {
       super.paintComponent(gg)
       val g = gg as Graphics2D
       g.setRenderingHint(RenderingHints.KEY_ANTIALIASING, RenderingHints.VALUE_ANTIALIAS_ON)
       drawGrid(g)
       drawSpiral(g)
   }
}
fun main(args: Array<String>) {
   SwingUtilities.invokeLater {
       val f = JFrame()
       f.defaultCloseOperation = JFrame.EXIT_ON_CLOSE
       f.title = "Archimedean Spiral"
       f.isResizable = false
       f.add(ArchimedeanSpiral(), BorderLayout.CENTER)
       f.pack()
       f.setLocationRelativeTo(null)
       f.isVisible = true
   }
}</lang>
Maple
<lang Maple> plots[polarplot](1+2*theta, theta = 0 .. 6*Pi) </lang>
Mathematica
The built-in function PolarPlot easily creates the desired plot <lang Mathematica>With[{a = 5, b = 4}, PolarPlot[a + b t, {t, 0, 10 Pi}]]</lang>
MATLAB
<lang MATLAB>a = 1; b = 1; turns = 2; theta = 0:0.1:2*turns*pi; polarplot(theta, a + b*theta);</lang>
PARI/GP
Note: cartes2() can be found here on PARI/GP page.
<lang parigp> \\ The Archimedean spiral \\ ArchiSpiral() - Where: lps is a number of loops, c is a direction 0/1 \\ (counter-clockwise/clockwise). 6/6/16 aev \\ Note: cartes2() can be found here on \\ http://rosettacode.org/wiki/Polyspiral#PARI.2FGP page. ArchiSpiral(size,lps,c=0)={ my(a=.0,ai=.1,r=.0,ri=.1,as=lps*2*Pi,n=as/ai,x,y,vc,vx=List(.0),vy=vx); if(c<0||c>1, c=0); if(c, ai*=-1); print(" *** The Archimedean spiral: size=",size," loops=",lps," c=",c); for(i=1, n, vc=cartes2(r,a); x=vc[1]; y=vc[2];
   listput(vx,x); listput(vy,y);
   r+=ri; a+=ai;
);\\fend i plothraw(Vec(vx),Vec(vy)); } {\\ Executing: ArchiSpiral(640,5); \\ArchiSpiral1.png ArchiSpiral(640,5,1); \\ArchiSpiral2.png } </lang>
- Output:
> ArchiSpiral(640,5);  \\ArchiSpiral1.png
 *** The Archimedean spiral: size=640 loops=5 c=0
> ArchiSpiral(640,5,1);  \\ArchiSpiral2.png
 *** The Archimedean spiral: size=640 loops=5 c=1
Perl
<lang Perl>use Imager; use constant PI => 3.14159265;
my ($w, $h) = (400, 400); my $img = Imager->new(xsize => $w, ysize => $h);
for ($theta = 0; $theta < 52*PI; $theta += 0.025) {
   $x = $w/2 + $theta * cos($theta/PI);
   $y = $h/2 + $theta * sin($theta/PI);
   $img->setpixel(x => $x, y => $y, color => '#FF00FF');
}
$img->write(file => 'Archimedean-spiral.png'); </lang>
Perl 6
<lang perl6>use Image::PNG::Portable;
my ($w, $h) = (400, 400);
my $png = Image::PNG::Portable.new: :width($w), :height($h);
(0, .025 ... 52*π).race.map: -> \Θ {
$png.set: |((cis( Θ / π ) * Θ).reals »+« ($w/2, $h/2))».Int, 255, 0, 255;
}
$png.write: 'Archimedean-spiral-perl6.png';</lang>
Phix
<lang Phix>-- -- demo\rosetta\Archimedean_spiral.exw -- include pGUI.e
Ihandle dlg, canvas cdCanvas cddbuffer, cdcanvas
function redraw_cb(Ihandle /*ih*/, integer /*posx*/, integer /*posy*/) integer a = 0, b = 5 integer {width, height} = IupGetIntInt(canvas, "DRAWSIZE") integer {centerX,centerY} = sq_floor_div({width,height},2)
   cdCanvasActivate(cddbuffer)
   for deg=0 to 360*7 do
       atom rad = deg*PI/180
       atom r = rad*b + a
       integer x = centerX + floor(r*cos(rad))
       integer y = centerY + floor(r*sin(rad))
       cdCanvasPixel(cddbuffer, x, y, #00FF00)
   end for
   cdCanvasFlush(cddbuffer)
   return IUP_DEFAULT
end function
function map_cb(Ihandle ih)
   cdcanvas = cdCreateCanvas(CD_IUP, ih)
   cddbuffer = cdCreateCanvas(CD_DBUFFER, cdcanvas)
   cdCanvasSetBackground(cddbuffer, CD_WHITE)
   cdCanvasSetForeground(cddbuffer, CD_RED)
   return IUP_DEFAULT
end function
function esc_close(Ihandle /*ih*/, atom c)
   if c=K_ESC then return IUP_CLOSE end if
   return IUP_CONTINUE
end function
procedure main()
IupOpen()
   canvas = IupCanvas(NULL)
   IupSetAttribute(canvas, "RASTERSIZE", "340x340") -- initial size
   IupSetCallback(canvas, "MAP_CB", Icallback("map_cb"))
   dlg = IupDialog(canvas)
   IupSetAttribute(dlg, "TITLE", "Archimedean spiral")
   IupSetCallback(dlg, "K_ANY",     Icallback("esc_close"))
   IupSetCallback(canvas, "ACTION", Icallback("redraw_cb"))
   IupMap(dlg)
   IupSetAttribute(canvas, "RASTERSIZE", NULL) -- release the minimum limitation
   IupShowXY(dlg,IUP_CENTER,IUP_CENTER)
   IupMainLoop()
   IupClose()
end procedure
main()</lang>
Processing
Processing examples are animated, with a new point / segment added each draw() frame. Because Processing includes multiple built-in ways for drawing in rotating frames of reference, there are several ways to approach the Archimedean spiral problem.
with points
When drawn with points the rotation must be very small, and initially the animation is very slow. This is because the points will move further and further apart as the radius increases. <lang Processing>float x, y; float theta; float rotation;
void setup() {
 size(300, 300);
 theta = 0;
 rotation = 0.1;
 background(255);
}
void draw() {
 translate(width/2.0, height/2.0);
 x = theta*cos(theta/PI);
 y = theta*sin(theta/PI);
 point(x, y);
 theta = theta + rotation;
 // check restart
 if (x>width/2.0) frameCount=-1;
}</lang>
with points, rotated
Rotates the canvas matrix using the built-in rotate() and draws a simple point, rather than computing rotated coordinates with sin()/cos(). <lang Processing>float theta; float rotation;
void setup() {
 size(300, 300);
 theta = 0;
 rotation = 0.1;
 background(255);
}
void draw() {
 translate(width/2.0, height/2.0);
 theta += rotation;
 rotate(theta/PI);
 point(theta, 0);
 // check restart
 if (theta>width/2.0) frameCount=-1;
}</lang>
with points, vector
Rotates a vector object of increasing magnitude using the built-in PVector and draws its point, rather than computing rotated coordinates with sin()/cos(). <lang Processing>PVector pv; float rotation;
void setup() {
 size(300, 300);
 rotation = 0.1;
 pv = new PVector(rotation, 0);
 background(255);
}
void draw() {
 translate(width/2.0, height/2.0);
 pv.setMag(pv.mag()+rotation);
 println(pv.mag());
 pv.rotate(rotation/PI);
 point(pv.x, pv.y);
 // check restart
 if (pv.mag()>width/2.0) frameCount=-1;
}</lang>
with line segments
Draw each new line segments anchored to the previous point in order to keep the spiral visually connected no matter how much the radius expands. <lang Processing>float px, py, x, y; float theta; float rotation;
void setup() {
 size(300, 300);
 px = py = x = y = theta = 0;
 rotation = 0.1;
 background(255);
}
void draw() {
 translate(width/2.0, height/2.0);
 x = theta*cos(theta/PI);
 y = (theta)*sin(theta/PI);
 line(x, y, px, py);
 theta = theta + rotation;
 px = x;
 py = y;
 // check restart
 if (px>width/2.0) frameCount=-1;
}</lang>
with line segments, rotated
Uses the built-in rotate() and screenX() to rotate the frame of reference and then recover the rotated screen position of each next point. Draw each new line segments anchored to the previous point in order to keep the spiral visually connected no matter how much the radius expands. <lang Processing>float x, y, px, py; float theta; float rotation;
void setup() {
 size(300, 300);
 x = y = px = py = theta = 0;
 rotation = 0.1;
 background(255);
}
void draw() {
 // find coordinates with rotating reference frame
 pushMatrix();
 rotate(theta/PI);
 x = screenX(theta, 0);
 y = screenY(theta, 0);
 popMatrix();
 translate(width/2.0, height/2.0);
 theta += rotation;
 line(px, py, x, y);
 px = x;
 py = y;
 if (theta>width/2.0) frameCount=-1; // start over
}</lang>
PureBasic
<lang PureBasic>#MAXLOOP = 7*360
- XCENTER = 640/2
- YCENTER = 480/2
- SCALAR = 200
If OpenWindow(0, 100, 200, 640, 480, "Archimedean spiral")
 If CreateImage(0, 640, 480,24,RGB(255,255,255))
   If StartDrawing(ImageOutput(0))
     i.f=0.0
     While i<=#MAXLOOP
       x.f=#XCENTER+Cos(Radian(i))*#SCALAR*i/#MAXLOOP
       y.f=#YCENTER+Sin(Radian(i))*#SCALAR*i/#MAXLOOP
       Plot(x,y,RGB(50,50,50))
       i+0.05
     Wend
     StopDrawing()
   EndIf
 EndIf
 ImageGadget(0, 0, 0, 0, 0, ImageID(0))
 Repeat : Event = WaitWindowEvent() : Until Event = #PB_Event_CloseWindow
EndIf End</lang>
Python
Using the turtle module.
<lang python>from turtle import * from math import * color("blue") down() for i in range(200):
   t = i / 20 * pi
   x = (1 + 5 * t) * cos(t)
   y = (1 + 5 * t) * sin(t)
   goto(x, y)
up() done()</lang>
R
<lang r>with(list(s=seq(0, 10 * pi, length.out=500)),
plot((1 + s) * exp(1i * s), type="l"))</lang>
Racket
File:Archemedian-spiral-racket.png <lang racket>#lang racket/base (require plot
racket/math)
- x and y bounds set to centralise the circle
(define (archemedian-spiral-renderer2d a b θ/τ-max
                                      #:samples (samples (line-samples)))
 (define (f θ) (+ a (* b θ)))
 (define max-dim (+ a (* θ/τ-max 2 pi b)))
 (polar f
     0 (* θ/τ-max 2 pi)
     #:x-min (- max-dim)
     #:x-max max-dim
     #:y-min (- max-dim)
     #:y-max  max-dim
     #:samples samples))
(plot (list (archemedian-spiral-renderer2d 0.0 24 4)))
- writes to a file so hopefully, I can post it to RC...
(plot-file (list (archemedian-spiral-renderer2d 0.0 24 4))
"images/archemidian-spiral-racket.png")</lang>
REXX
This REXX version allows the user to specify (or override) the various constants used to calculate and display the spiral (plot).
Note: the value of a doesn't mean that much as the plot is automatically centered. <lang rexx>/*REXX pgm plots several cycles (half a spiral) of the Archimedean spiral (ASCII plot).*/ parse arg cy a b inc chr . /*obtain optional arguments from the CL*/ if cy== | cy=="," then cy= 3 /*Not specified? Then use the default.*/ if a== | a=="," then a= 1 /* " " " " " " */ if b== | b=="," then b= 9 /* " " " " " " */ if inc== | inc=="," then inc= 0.02 /* " " " " " " */ if chr== | chr=="," then chr= '∙' /* " " " " " " */ if length(chr)==3 then chr= d2c(chr) /*plot character coded in decimal? */ if length(chr)==2 then chr= x2c(chr) /* " " " " hexadecimal? */ cy= max(2, cy); LOx= . /*set the LOx variable (a semaphore).*/ parse value scrsize() with sd sw . /*get the size of the terminal screen. */ w= sw - 1 ; mw= w * (cy-1) * 4 /*set useable width; max width for calc*/ h= sd - 1 + cy*10; mh= h * (cy-1) /* " " depth; " depth " " */ @.= /*initialize the line based plot field.*/
        do t=1  to pi()*cy  by inc              /*calc all the coördinates for spiral. */
        r= a +  b*    t                         /*  "   "   "       R       "    "     */
        x= w +  r*cos(t);     xx= x % 2         /*  "   "   "       X       "    "     */
        y= h +  r*sin(t);     yy= y % 2         /*  "   "   "       Y       "    "     */
        if x<0 | y<0 | x>mw | y>mh then iterate /*Is X or Y  out of bounds?  Then skip.*/
        if LOx==.  then do;   LOx=xx;      HIx=xx;      LOy=yy;       HIy=yy
                        end                     /* [↑]  find the minimums and maximums.*/
        LOx= min(LOx, xx);    HIx= max(HIx, xx) /*determine the   X   MIN  and  MAX.   */
        LOy= min(LOy, yy);    HIy= max(HIy, yy) /*    "      "    Y    "    "    "     */
        @.yy= overlay(chr, @.yy, xx+1)          /*assign the plot character (glyph).   */
        end   /*t*/
call plot /*invoke plotting subroutine (to term).*/ exit /*stick a fork in it, we're all done. */ /*──────────────────────────────────────────────────────────────────────────────────────*/ pi: pi=3.1415926535897932384626433832795028841971693993751058209749445923078; return pi plot: do row=HIy to LOy by -1; say substr(@.row, LOx+1); end; return r2r: return arg(1) // (pi() * 2) /*normalize radians ───► a unit circle.*/ /*──────────────────────────────────────────────────────────────────────────────────────*/ cos: procedure; parse arg x; x= r2r(x); a= abs(x); hpi= pi * .5
      numeric fuzz  min(6, digits() - 3);        if a=pi       then return -1
      if a=hpi | a=hpi*3  then return  0         if a=pi / 3   then return .5
      if a=pi * 2 / 3     then return -.5;                          return .sinCos(1, -1)
/*──────────────────────────────────────────────────────────────────────────────────────*/ sin: procedure; parse arg x; x= r2r(x); numeric fuzz min(5, max(1, digits() -3))
      if x=pi * .5         then return 1;        if x==pi*1.5  then return -1
      if abs(x)=pi | x=0   then return 0;                           return  .sinCos(x, 1)
/*──────────────────────────────────────────────────────────────────────────────────────*/ .sinCos: parse arg z 1 _,i; q= x*x
do k=2 by 2 until p=z; p= z; _= -_*q/(k*(k+i)); z= z+_; end; return z</lang>
- output when using the following inputs: 13 , 5 , db
(Output is shown at 1/20 size.)
█ █ █ ██ █
█ █ █ █ █ █ █ █ █ █
█ █ █ █ █
█ █ █ █ █
█ █ █
█ █ █ █
█ █ █
█ █
█ █ █
█ ██
█ █
█ █
█ █
█ █
█ █
█ █
█ █ █ ██ █ ██ █ ██ █ █
█ ██ █ █ ██ █ █ █
█ █ ██ █ ██ █
█ ██ █ █ █
█ █ █ █ █
█ █ █ █ █
█ █ █ █ █
█ ██ █ █
█ █ ██ █
█ █ █
██ █ █
█ █ █ █
█ █ █ █ █
█ █
█ █ █ █
█ █ █ █
█ █ ███ ███ ███ ███ ███ █ █
█ █ ███ ███ █ █
█ █ █ ██ ██ █ █ █
█ █ ██ ██ █ █
█ ██ █ ██ █
█ █ ██ █ █ █
█ ██ █ █ █ █
█ █ ██ ██ █
█ █ █ █
█ ██ ██ █ █
█ █ █ █ █
█ █ ██ █ █
█ █ █ █ █ █
█ █ █ █ █
█ █ ██ █
█ █ █ █████ █ █ █
█ █ ███████ ███████ █ █ █
█ █ ████ ████ █ █
█ █ █ ███ ████ █ █
█ █ ███ ██ █ █ █
█ █ █ ██ ███ █ █
█ ██ ██ █ █ █
█ █ █ ██ ██ █
█ █ █ █ █ █ █
█ █ ██ █ █ █ █
█ █ █ ██ █ █
█ █ █ ██ ██ █ █
█ █ █ █ █ █
█ █ ██ ██ █ █ █
█ █ █ █ █ █
█ ██ ██ █ █ █
█ █ █ █ ████████████ █ █ █ █
█ █ █████ ████ ██ █
█ █ █ ███ ████ █ █ █ █
█ █ █ ███ ███ █ █ █
█ █ █ █ ██ ███ █ █
█ █ ██ ██ █ █ █
█ █ █ ███ ██ █ █ █ █
█ █ ██ █ █ █
█ █ █ █ ██ ██ █ █ █ █
█ █ ██ █ ██ █ █ █
█ █ █ █ ██ █ █
█ █ █ ██ █ █ █ █
█ █ █ █ █ ██ █ █ █
█ █ █ ██ █ █ █
█ █ █ █ ██ █ █ █ █
█ ██ █ █ █ █ █
█ █ █ █ █ ████████████ █ █
█ █ █ █ ███ ███ █ █ █ █ █
█ █ █ █ ██ ███ █ ██ █ █
█ █ █ ██ ██ █ █ █ █
█ █ █ █ ██ ██ ██ █ █ █
█ █ █ █ ██ ██ █ █ █ █
█ █ █ █ █ ██ ██ █ █ █
█ █ ██ █ █ █ █ █ █
█ █ █ █ █ ██ █ █ █ █
█ █ ██ ██ █ █ █ █ █
█ █ █ █ █ █ █ █ █ █
█ █ █ ██ ██ █ █ █
█ █ █ █ █ █ █ █ █ █ █ █
█ █ █ █ █ █ █ █ █ █
█ █ █ █ ██ █ █ █ █
█ █ █ █ ██ █████ █ █ █ █
█ █ █ █ █ ███ ███ █ █ █ █ █
█ █ █ █ ██ █ █ █ █ █ █
█ █ █ █ █ █ █ █ █ █ █ █ █
█ █ █ █ ██ █ █ █
█ █ █ █ █ █ █ █ █ █ █ █ █
█ █ █ ██ █ █ █ █
█ █ █ █ █ █ █ █ █ █ █
█ █ █ █ █ █ █ █ █ █
█ █ █ █ █ ██ █ █ █ █
█ █ █ █ █ █ █ █ █ █
█ █ █ █ ██ ██ █ █ █ █ █
█ █ █ █ █ ██ █ █ █ █
█ █ █ █ ██ █ █ █ █ █
█ █ █ █ █ ██ █ █ █ █ █
█ █ ██ ██ ██ █ █ █
█ █ █ █ ███ ███ ██ █ █ █ █
█ █ █ █ █ █████ █████ █ █ █ █
█ █ █ █ ███ ██ ██ █ █
█ █ █ █ █ █ █ █
█ █ █ █ █ █ █ █
█ █ █ █ █ ██ █ █
█ █ █ █ ██ █ █ █ █
█ █ █ █ █ █ █ █
█ █ █ █ ██ █ █ █ █
█ █ █ ██ █ █ █ █ █
█ █ █ ██ █ █ █
█ █ ██ ██ ██ █ █ █
█ █ █ ██ ██ ██ █ █
█ █ █ █ ██ ██ █ █ █ █
█ █ ██ ███ █ █
█ █ █ ██ ███ ████ ██ █ █ █
█ █ █ ████ ████ █ █ █
█ █ █ █ █████████████ █ █ █
█ █ █ ██ █ █ █
█ █ ██ █ █ █
█ █ █ █ ██ █ █
█ █ ██ █ █
█ █ ██ █ █ █ █
█ █ █ ██ █ █ █
█ ██ █ ██ █ █
█ █ █ ██ █ █ █ █
█ ██ ██ █ █
█ █ █ ██ █ █ █ █
█ █ █ ███ ███ █
█ █ ██ ██ █ █ █
█ █ █ ███ ████ █ █ █
█ ██ ████ ███ █ █
█ █ ██████ ██████ █ █
█ █ █ ██████████ █ █
█ █ ██ █ █
█ █ ██ █ █ █
█ █ █ █ █
█ ██ ██ █ █
█ █ █
█ █ ██ ██ █ █
█ █ █ █ █
█ █ ██ ██ █
█ █ ██ █ █ █ █
█ █ ██ ██ █ █
█ ██ ██ █
█ █ ███ ███ █ █
█ █ ██ █ ███ █ █
█ ████ ███ █ █
█ █ ██ ████ ██████ ██████ █
█ █ █ █
█ ██ █ █
█ █
█ █ █ █ █
█ █ █ █
█ ██ █ █
█ █ ██ █
██ █
█ █ ██ █
█ ██ █ █
█ █ █ ██ █
█ █ █ ██ █
█ ██ ██ █
█ ██ █ ██ █
█ █ ██ █ ██ ██ █
█ █ ██ ██ ██ ██ ██ ██ █
█ █
█ █
█ █
█ █ █
█ █
█ █
█ █ █
█ █ █
█ █
██ █ █
█ █ █
██ ██
█ █ █ █
██ █ ██ █
█ █ ██ █ █ █ █
█ █ █ ██ █ █ █ █
Ring
<lang ring> /*
+---------------------------------------------------------------------------------------------------------
+     Program Name : Archimedean spiral
+---------------------------------------------------------------------------------------------------------
- /
Load "guilib.ring"
horzSize = 400 vertSize = 400
counter = 0 ### cycle thru colors colorRed = new qcolor() { setrgb(255,000,000,255) } colorGreen = new qcolor() { setrgb(000,255,000,255) } colorBlue = new qcolor() { setrgb(000,000,255,255) } colorYellow = new qcolor() { setrgb(255,255,000,255) }
penUseR = new qpen() { setcolor(colorRed) setwidth(1) } penUseG = new qpen() { setcolor(colorGreen) setwidth(1) } penUseB = new qpen() { setcolor(colorBlue) setwidth(1) } penUseY = new qpen() { setcolor(colorYellow) setwidth(1) }
       deg2rad    = atan(1) * 4 / 180
       screensize = 600
       turns      = 5
       halfscrn   = screensize / 2
       sf         = (turns * (screensize - 100)) / halfscrn
       x = 1
       y = 1
       r = 0
       inc = 0.50   ### control increment speed of r
New qapp {
  win1 =  new qwidget()
   {
       setwindowtitle("Draw Spiral")
       setgeometry(100,100,600,600)

      label1 = new qlabel(win1)
      {
          setgeometry(10,10,600,600)
          settext("")
      }


      Canvas = new qlabel(win1)
      {
           MonaLisa = new qPixMap2( 600,600)
           color    = new qcolor(){ setrgb(255,0,0,255) }
           daVinci  = new qpainter()
           {
              begin(MonaLisa)
              penUse = new qpen() { setcolor(colorRed) setwidth(1) }
              setpen(penUseR)
              #endpaint()      ### This will Stop the Painting
           }

           setpixmap(MonaLisa)
      }

       oTimer = new qTimer(win1)
       {
           setinterval(1)    ### 1 millisecond
           settimeoutevent("DrawCounter()")
           start()
       }

      show()   ### Will show Painting ONLY after exec
   }
  exec()
}
- ====================================================
Func DrawCounter()
   x  = cos(r * deg2rad) * r / sf
   y  = sin(r * deg2rad) * r / sf
   r += inc   ###  0.20 fast, 0.90 slow
       if r >= turns * 360
           r = inc
           x = 1
           y = 1
           counter++
           whichColor = counter % 4
           See  "whichColor: "+ whichColor +nl
               if whichColor = 0 daVinci.setpen(penUseR)  ok
               if whichColor = 1 daVinci.setpen(penUseG)  ok
               if whichColor = 2 daVinci.setpen(penUseB)  ok
               if whichColor = 3 daVinci.setpen(penUseY)  ok
ok
   hpoint = halfscrn + x
   ypoint = halfscrn - y
   daVinci.drawpoint(hpoint, ypoint)
   Canvas.setpixmap(MonaLisa)          ### Need this setpixmap to display imageLabel
   win1.show()                         ### Need this show to display imageLabel
return </lang>
Rust
<lang rust>#[macro_use(px)] extern crate bmp;
use bmp::{Image, Pixel}; use std::f64;
fn main() {
   let width = 600u32;
   let half_width = (width / 2) as i32;
   let mut img = Image::new(width, width);
   let draw_color = px!(255, 128, 128);
   // Constants defining the spiral size.
   let a = 1.0_f64;
   let b = 9.0_f64;
   // max_angle = number of spirals * 2pi.
   let max_angle = 5.0_f64 * 2.0_f64 * f64::consts::PI;
   let mut theta = 0.0_f64;
   while theta < max_angle {
       theta = theta + 0.002_f64;
       let r = a + b * theta;
       let x = (r * theta.cos()) as i32 + half_width;
       let y = (r * theta.sin()) as i32 + half_width;
       img.set_pixel(x as u32, y as u32, draw_color);
   }
   // Save the image
   let _ = img.save("archimedean_spiral.bmp").unwrap_or_else(|e| panic!("Failed to save: {}", e));
}</lang>
SAS
<lang sas>data xy; h=constant('pi')/40; do i=0 to 400;
   t=i*h;
   x=(1+t)*cos(t);
   y=(1+t)*sin(t);
   output;
end; keep x y; run;
proc sgplot; series x=x y=y; run;</lang>
Scala
Java Swing Interoperability
<lang Scala>
object ArchimedeanSpiral extends App {
 SwingUtilities.invokeLater(() =>
   new JFrame("Archimedean Spiral") {
     class ArchimedeanSpiral extends JPanel {
       setPreferredSize(new Dimension(640, 640))
       setBackground(Color.white)
       private def drawGrid(g: Graphics2D): Unit = {
         val (angle, margin, numRings) = (toRadians(45), 10, 8)
         val w = getWidth
         val (center, spacing) = (w / 2, (w - 2 * margin) / (numRings * 2))
         g.setColor(new Color(0xEEEEEE))
         for (i <- 0 until numRings) {
           val pos = margin + i * spacing
           val size = w - (2 * margin + i * 2 * spacing)
           g.drawOval(pos, pos, size, size)
           val ia = i * angle
           val x2 = center + (cos(ia) * (w - 2 * margin) / 2).toInt
           val y2 = center - (sin(ia) * (w - 2 * margin) / 2).toInt
           g.drawLine(center, center, x2, y2)
         }
       }
       private def drawSpiral(g: Graphics2D): Unit = {
         val (degrees: Double, center) = (toRadians(0.1), getWidth / 2)
         val (a, b, c, end) = (0, 20, 1, 360 * 2 * 10 * degrees)
def plot(g: Graphics2D, x: Int, y: Int): Unit = g.drawOval(x, y, 1, 1)
         def iter(theta: Double): Double = {
           if (theta < end) {
             val r = a + b * pow(theta, 1 / c)
             val x = r * cos(theta)
             val y = r * sin(theta)
             plot(g, (center + x).toInt, (center - y).toInt)
             iter(theta + degrees)
           } else theta
         }
         g.setStroke(new BasicStroke(2))
         g.setColor(Color.orange)
         iter(0)
       }
       override def paintComponent(gg: Graphics): Unit = {
         super.paintComponent(gg)
         val g = gg.asInstanceOf[Graphics2D]
         g.setRenderingHint(RenderingHints.KEY_ANTIALIASING, RenderingHints.VALUE_ANTIALIAS_ON)
         drawGrid(g)
         drawSpiral(g)
       }
     }
     add(new ArchimedeanSpiral, BorderLayout.CENTER)
     pack()
     setDefaultCloseOperation(WindowConstants.EXIT_ON_CLOSE)
     setLocationRelativeTo(null)
     setResizable(false)
     setVisible(true)
   }
 )
}</lang>
Scilab
<lang>a = 3; b = 2;
theta = linspace(0,10*%pi,1000); r = a + b .* theta;
//1. Plot using polar coordinates scf(1); polarplot(theta,r);
//2. Plot using rectangular coordinates //2.1 Convert coordinates using Euler's formula z = r .* exp(%i .* theta); x = real(z); y = imag(z);
scf(2); plot2d(x,y);</lang>
Scheme
<lang scheme> (import (scheme base)
       (scheme complex)
       (rebottled pstk))
- settings for spiral
(define *resolution* 0.01) (define *count* 2000) (define *a* 10) (define *b* 10) (define *center*
 (let ((size 200)) ; change this to alter size of display
   (* size 1+i)))
(define (draw-spiral canvas)
 (define (coords theta)
   (let ((r (+ *a* (* *b* theta))))
     (make-polar r theta)))
 ;
 (do ((i 0 (+ i 1))) ; loop to draw spiral
   ((= i *count*) )
   (let ((c (+ (coords (* i *resolution*)) *center*)))
     (canvas 'create 'line
             (real-part c) (imag-part c)
             (+ 1 (real-part c)) (imag-part c)))))
(let ((tk (tk-start)))
 (tk/wm 'title tk "Archimedean Spiral")
 (let ((canvas (tk 'create-widget 'canvas)))
   (tk/pack canvas)
   (canvas 'configure
           'height: (* 2 (real-part *center*))
           'width: (* 2 (imag-part *center*)))
   (draw-spiral canvas))
 (tk-event-loop tk))
</lang>
Seed7
<lang seed7>$ include "seed7_05.s7i";
 include "draw.s7i";
 include "keybd.s7i";
const proc: main is func
 local
   const float: xCenter is 117.0;
   const float: yCenter is 139.0;
   const float: maxTheta is 10.0 * PI;
   const float: delta is 0.01;
   const float: a is 1.0;
   const float: b is 7.0;
   var float: theta is 0.0;
   var float: radius is 0.0;
 begin
   screen(256, 256);
   clear(curr_win, black);
   KEYBOARD := GRAPH_KEYBOARD;
   while theta <= maxTheta do
     radius := a + b * theta;
     point(round(xCenter + radius * cos(theta)),
           round(yCenter - radius * sin(theta)), white);
     theta +:= delta;
   end while;
   DRAW_FLUSH;
   ignore(getc(KEYBOARD));
 end func;</lang>
Sidef
<lang ruby>require('Imager') define π = Num.pi
var (w, h) = (400, 400) var img = %O<Imager>.new(xsize => w, ysize => h)
for Θ in (0 .. 52*π -> by(0.025)) {
   img.setpixel(
       x => floor(cos(Θ / π)*Θ + w/2),
       y => floor(sin(Θ / π)*Θ + h/2),
       color => [255, 0, 0]
   )
}
img.write(file => 'Archimedean_spiral.png')</lang> Output image: Archimedean spiral
Stata
<lang stata>clear all scalar h=_pi/40 set obs 400 gen t=_n*h gen x=(1+t)*cos(t) gen y=(1+t)*sin(t) line y x</lang>
Tcl
This creates a little Tk GUI where you can interactively enter values for `a` and `b`. The spiral will be re-drawn automatically thanks to `trace`:
<lang Tcl>package require Tk
- create widgets
canvas .canvas frame .controls
ttk::label .legend -text " r = a + b θ " ttk::label .label_a -text "a =" ttk::entry .entry_a -textvariable a ttk::label .label_b -text "a =" ttk::entry .entry_b -textvariable b button .button -text "Redraw" -command draw
- layout
grid .canvas .controls -sticky nsew grid .legend - -sticky ns -in .controls grid .label_a .entry_a -sticky nsew -in .controls grid .label_b .entry_b -sticky nsew -in .controls grid .button - -sticky ns -in .controls
- make the canvas resize with the window
grid columnconfigure . 0 -weight 1 grid rowconfigure . 0 -weight 1
- spiral parameters:
set a .2 set b .05
proc draw {} {
   variable a
   variable b
   # make sure inputs are valid:
   if {![string is double $a] || ![string is double $b]} return
   if {$a == 0 || $b == 0} return
   set w [winfo width .canvas]
   set h [winfo height .canvas]
   set r 0
   set pi [expr {4*atan(1)}]
   set step [expr {$pi / $w}]
   for {set t 0} {$r < 2} {set t [expr {$t + $step}]} {
       set r [expr {$a + $b * $t}]
       set y [expr {sin($t) * $r}]
       set x [expr {cos($t) * $r}]
       # transform to canvas co-ordinates
       set y [expr {entier((1+$y)*$h/2)}]
       set x [expr {entier((1+$x)*$w/2)}]
       lappend coords $x $y
   }
   .canvas delete all
   set id [.canvas create line $coords -fill red]
}
- draw whenever parameters are changed
- ";#" so extra trace arguments are ignored
trace add variable a write {draw;#} trace add variable b write {draw;#}
wm protocol . WM_DELETE_WINDOW exit ;# exit when window is closed
update ;# lay out widgets before trying to draw draw vwait forever ;# go into event loop until window is closed</lang>
VBA
<lang vb>Private Sub plot_coordinate_pairs(x As Variant, y As Variant)
   Dim chrt As Chart
   Set chrt = ActiveSheet.Shapes.AddChart.Chart
   With chrt
       .ChartType = xlXYScatter
       .HasLegend = False
       .SeriesCollection.NewSeries
       .SeriesCollection.Item(1).XValues = x
       .SeriesCollection.Item(1).Values = y
   End With
End Sub Public Sub main()
   Dim x(1000) As Single, y(1000) As Single
   a = 1
   b = 9
   For i = 0 To 1000
       theta = i * WorksheetFunction.Pi() / 60
       r = a + b * theta
       x(i) = r * Cos(theta)
       y(i) = r * Sin(theta)
   Next i
   plot_coordinate_pairs x, y
End Sub</lang>
Yabasic
<lang Yabasic>5 OPEN WINDOW 320, 200 : WINDOW ORIGIN "CC" 10 LET A=1.5 20 LET B=0.7 30 FOR T=0 TO 30*PI STEP 0.05 40 LET R=A+B*T 50 LINE TO R*COS(T),R*SIN(T) 60 NEXT T</lang>
zkl

Uses the PPM class from http://rosettacode.org/wiki/Bitmap/Bresenham%27s_line_algorithm#zkl <lang zkl>fcn archimedeanSpiral(a,b,circles){
  w,h:=640,640; centerX,centerY:=w/2,h/2;
  bitmap:=PPM(w+1,h+1,0xFF|FF|FF);  // White background
  foreach deg in ([0.0 .. 360*circles]){
     rad:=deg.toRad();
     r:=rad*b + a;
     x,y:=r.toRectangular(rad);
     bitmap[centerX + x, centerY + y] = 0x00|FF|00;  // Green dot
  }
  bitmap.writeJPGFile("archimedeanSpiral.jpg");
}(0,5,7);</lang>
- Programming Tasks
- Solutions by Programming Task
- Ada
- SDLAda
- AWK
- BASIC
- Applesoft BASIC
- BASIC256
- Commodore BASIC
- FreeBASIC
- IS-BASIC
- Run BASIC
- QBASIC
- Sinclair ZX81 BASIC
- C
- C++
- C sharp
- Common Lisp
- Clojure
- Frege
- Go
- Haskell
- Juicy.Pixels
- Rasterific
- J
- Java
- JavaScript
- Pages with broken file links
- Julia
- Kotlin
- Maple
- Mathematica
- MATLAB
- PARI/GP
- Perl
- Perl 6
- Phix
- PGUI
- Processing
- PureBasic
- Python
- R
- Racket
- REXX
- Ring
- Rust
- SAS
- Scala
- Scilab
- Scheme
- Scheme/PsTk
- Seed7
- Sidef
- Stata
- Tcl
- VBA
- Yabasic
- Zkl